📝 14 Jan 2026
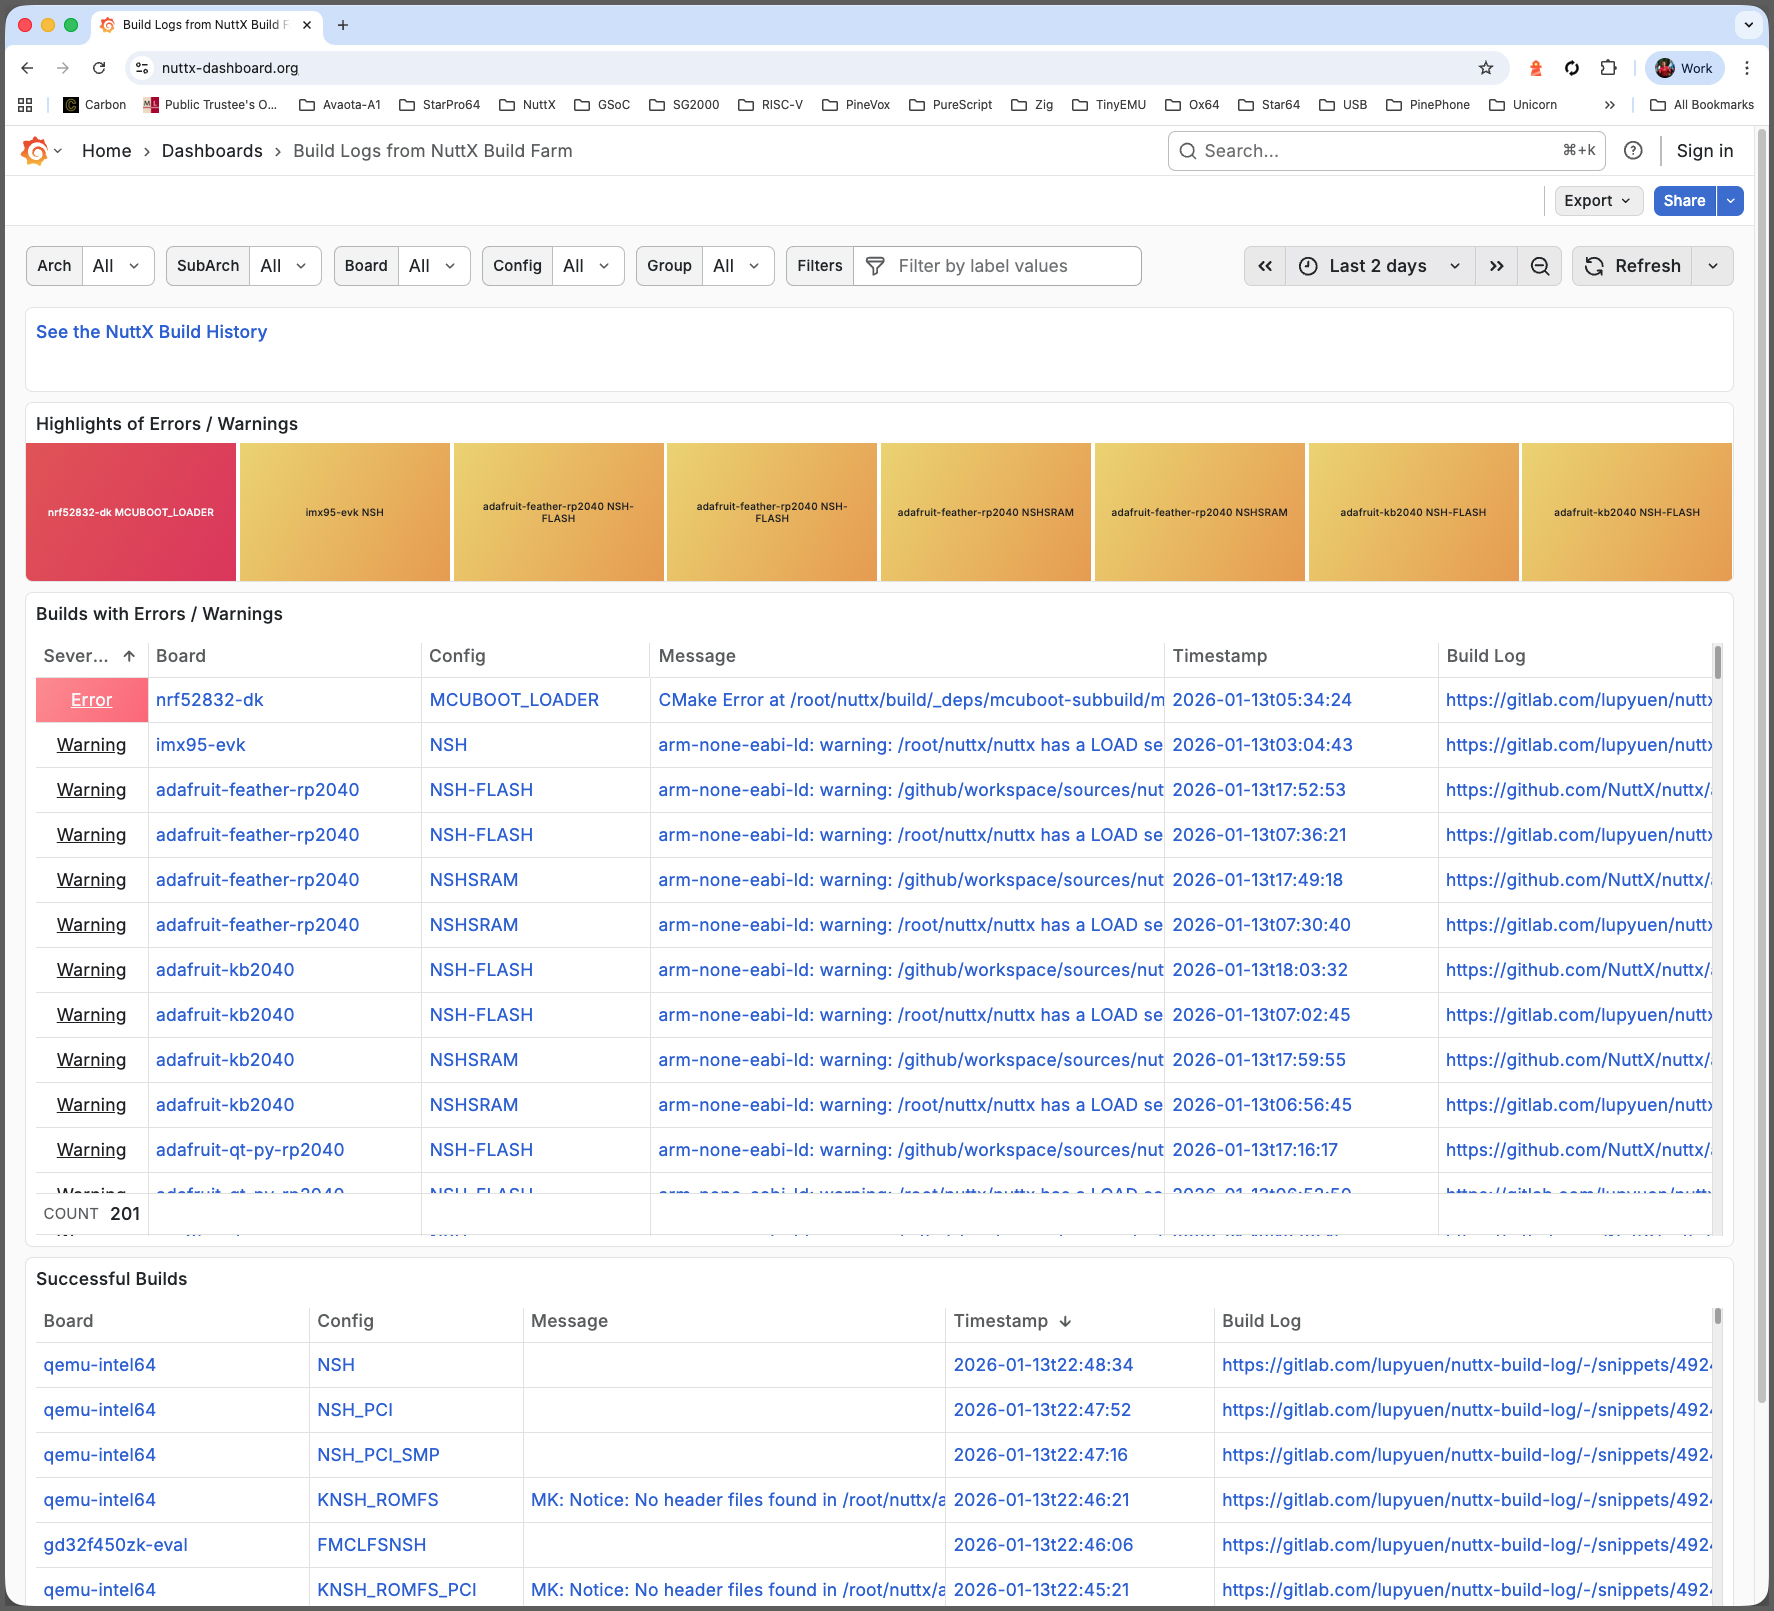
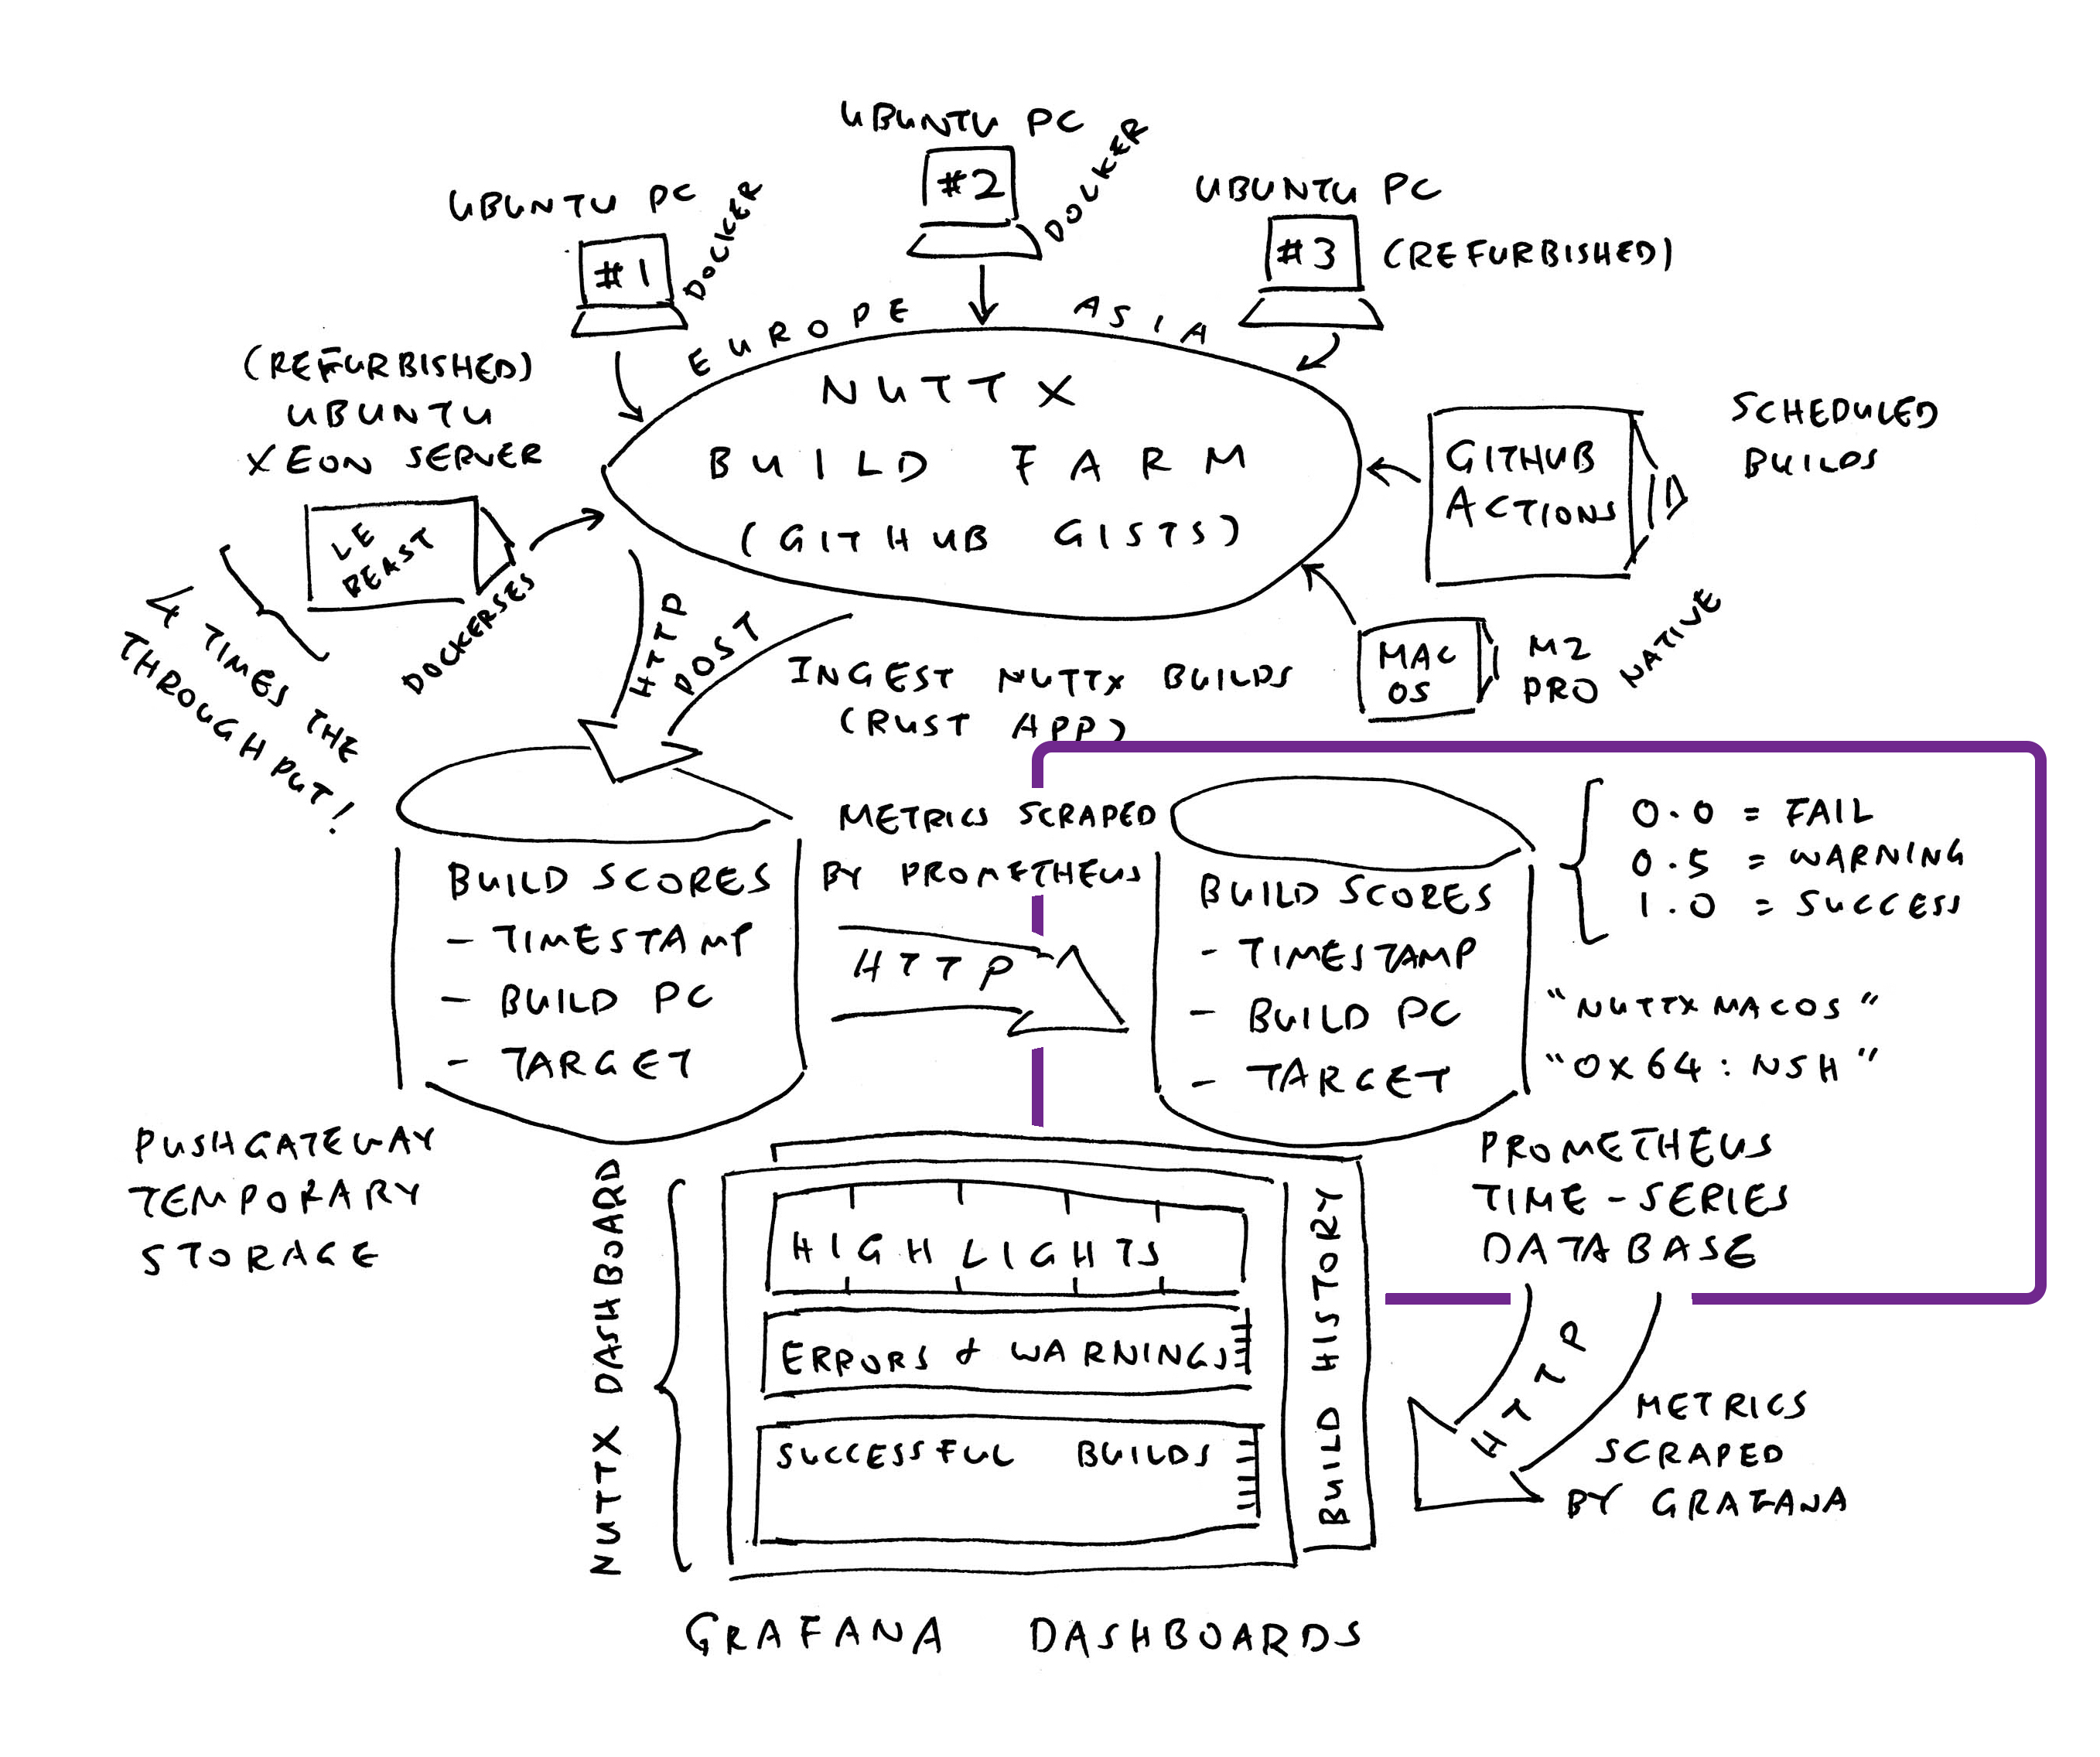
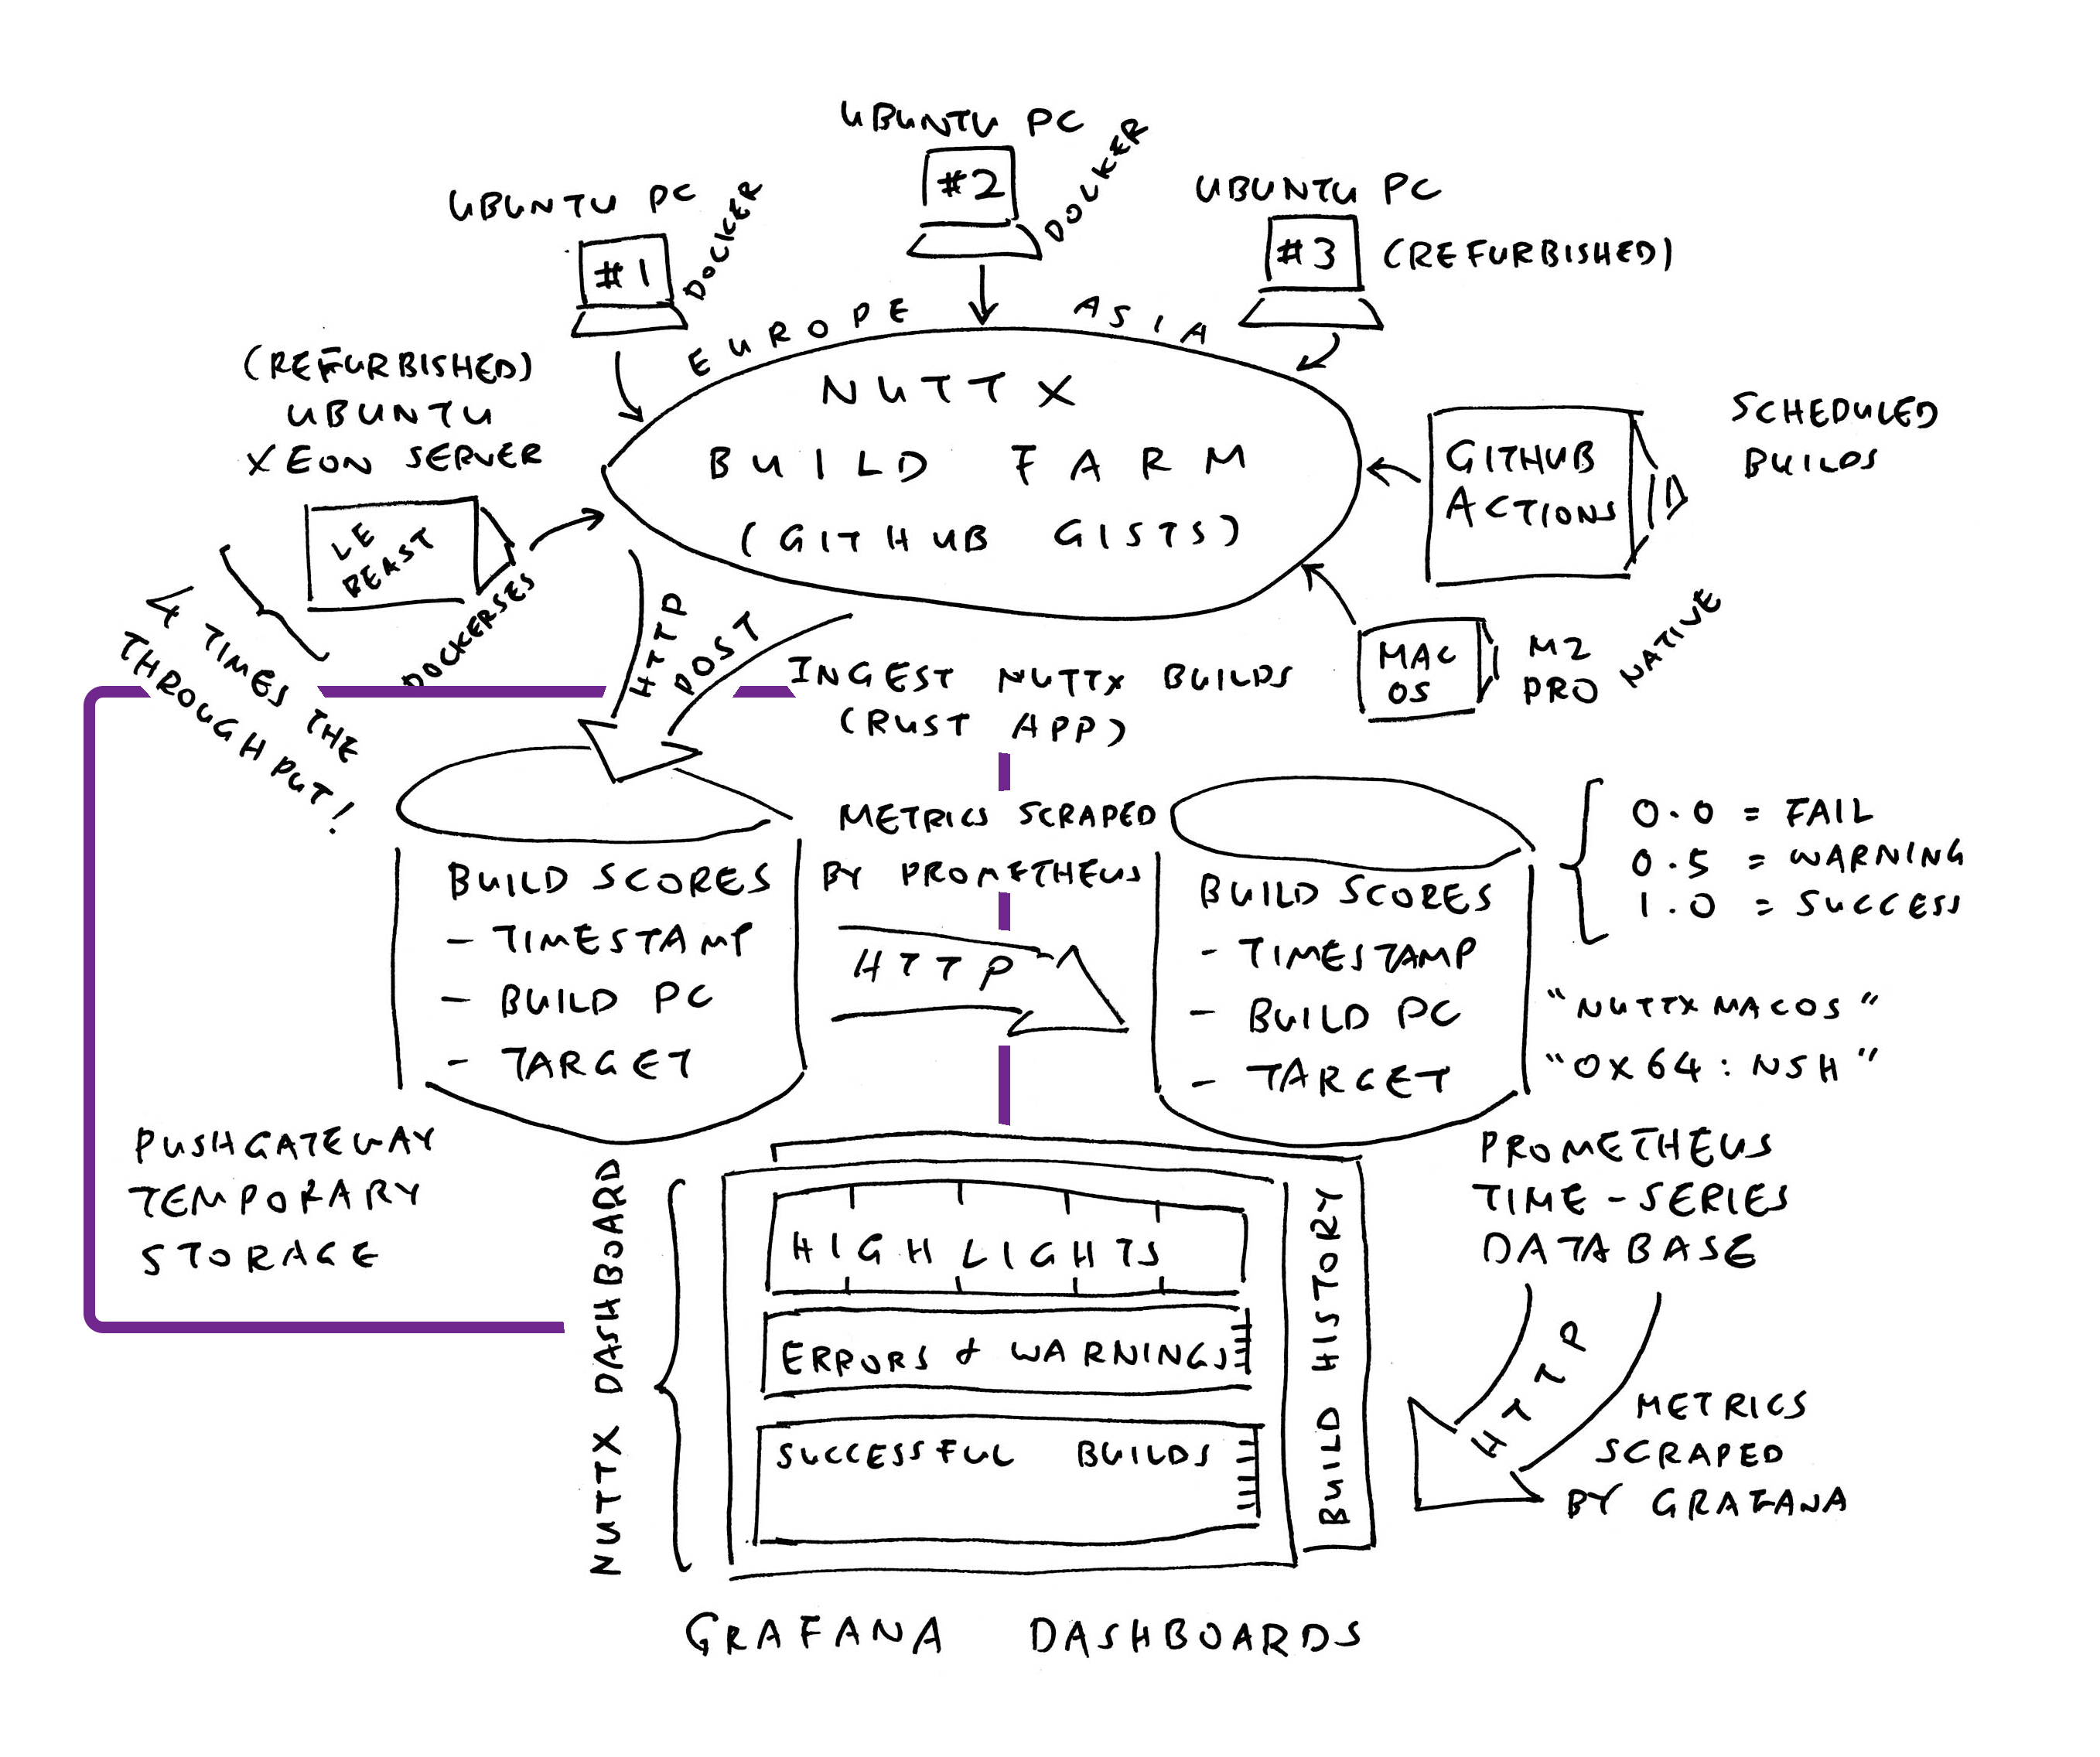
12 Months Ago: We created a Grafana Dashboard (pic above) that monitors the successful / failed Daily Builds of Apache NuttX RTOS, across all 339 microcontroller boards. So we’ll be alerted (via Mastodon) if NuttX fails to build for (say) RP2040…
Was everything hunky dory?
Nope! Grafana Dashboard was running on a (macOS) Home Computer. Thus if we’re overseas for Marathon Races and there’s a Home Power Outage… NuttX Dashboard goes down and never recovers!
Today, let’s migrate NuttX Dashboard from our Home Computer to Google Cloud VM. It will cost more, and we don’t have the Hosting Budget. But at least NuttX Dashboard will continue running when the lights go poof.
What if we prefer another cloud? Or our own machine?
The steps below will work for any Debian Bookworm machine. Hopefully someday we’ll budget for the machine. (And secure it too)
Will it be cheaper on an Asian Cloud? Like AliCloud?
Hmmm interesting… We should try it sometime!
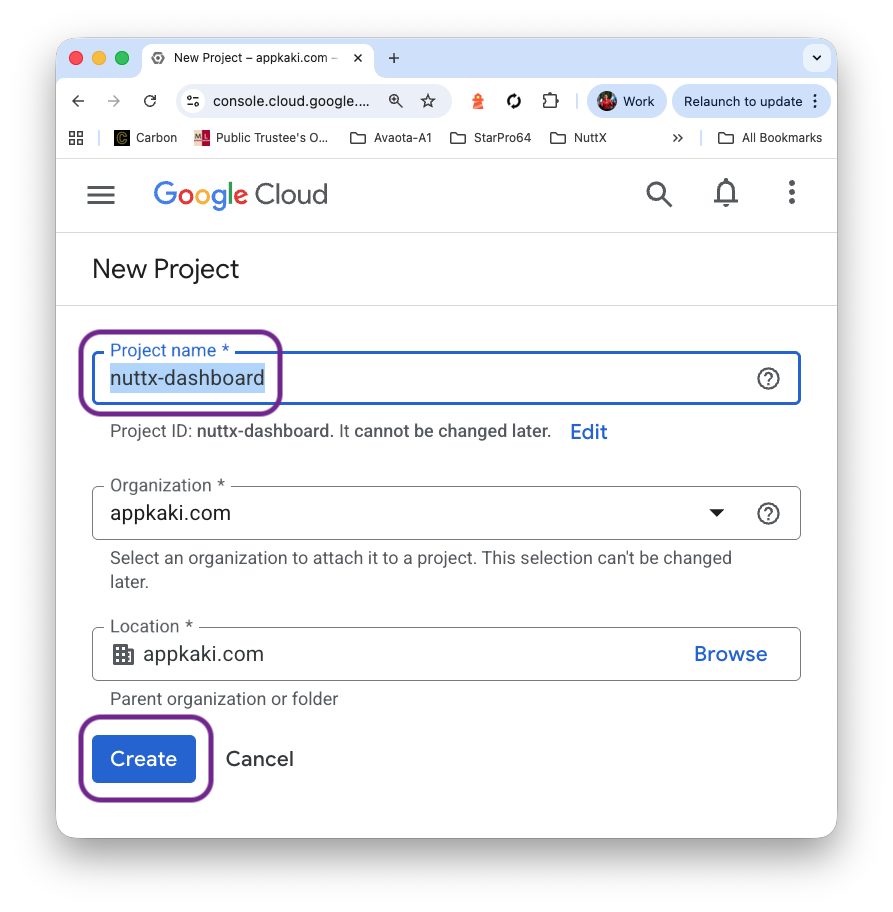
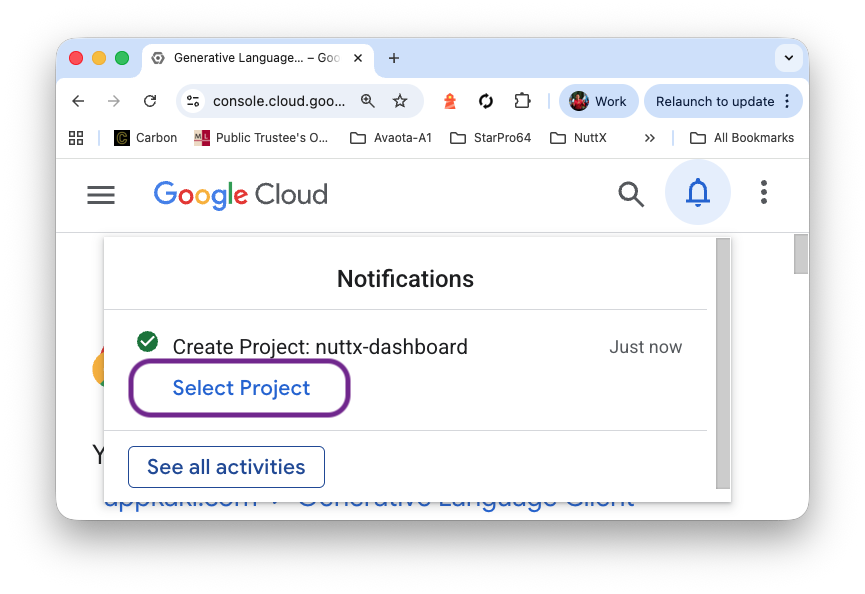
We begin by creating a Google Cloud Project that will operate our VM (pic above). We named it nuttx-dashboard…
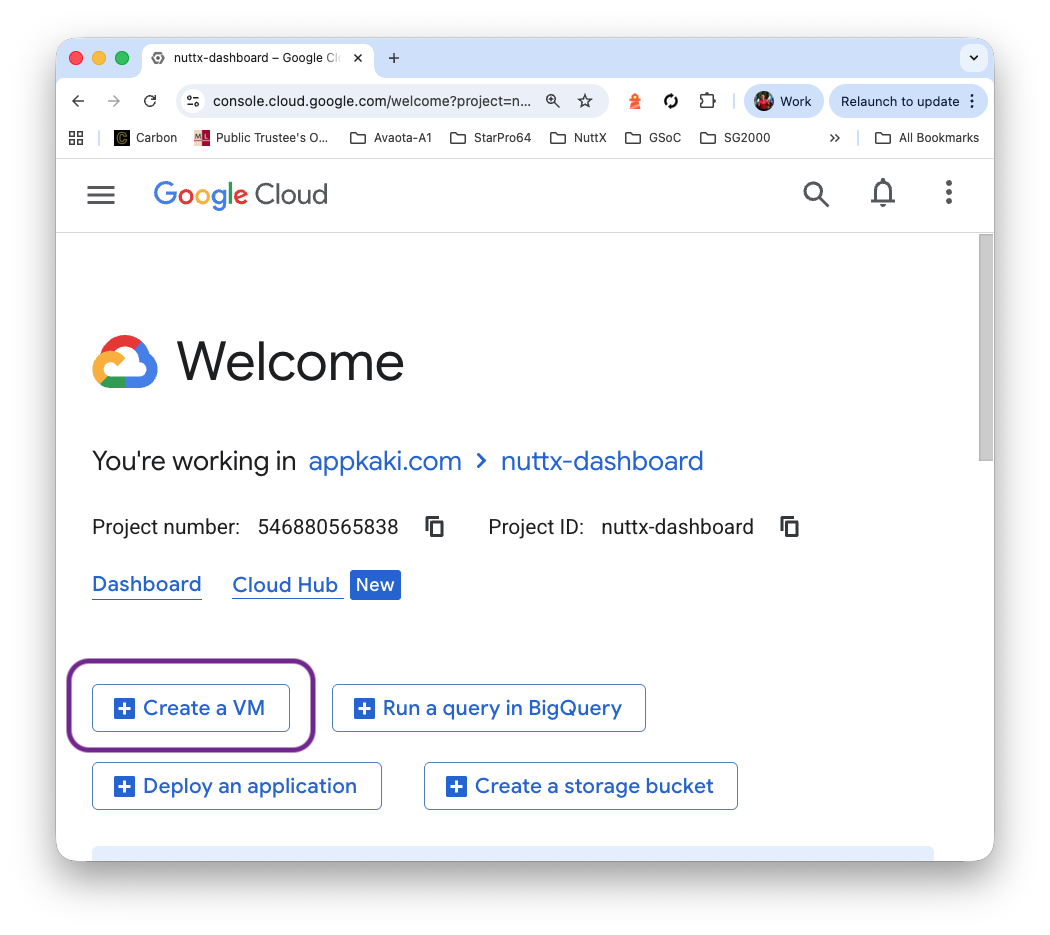
Then we create our Virtual Machine…
Click “Select Project”
Click “Create a VM”
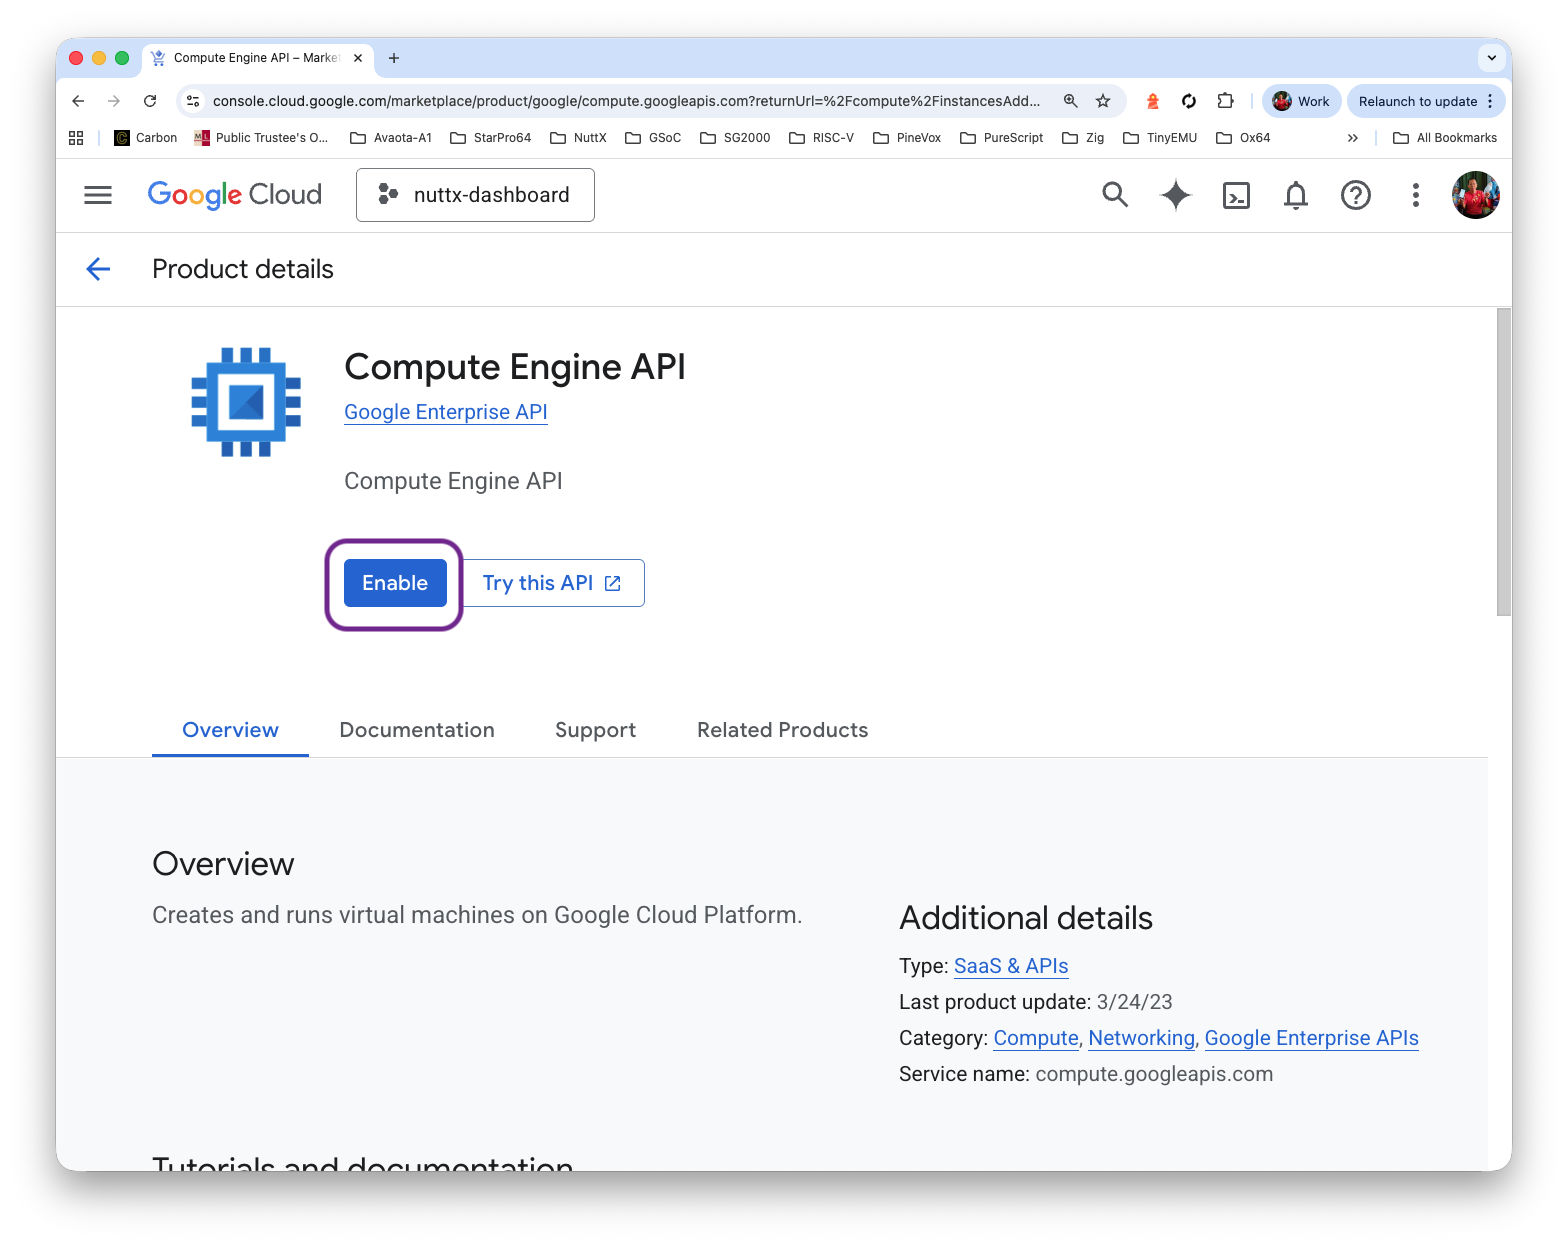
Click “Compute Engine API > Enable” and wait a while
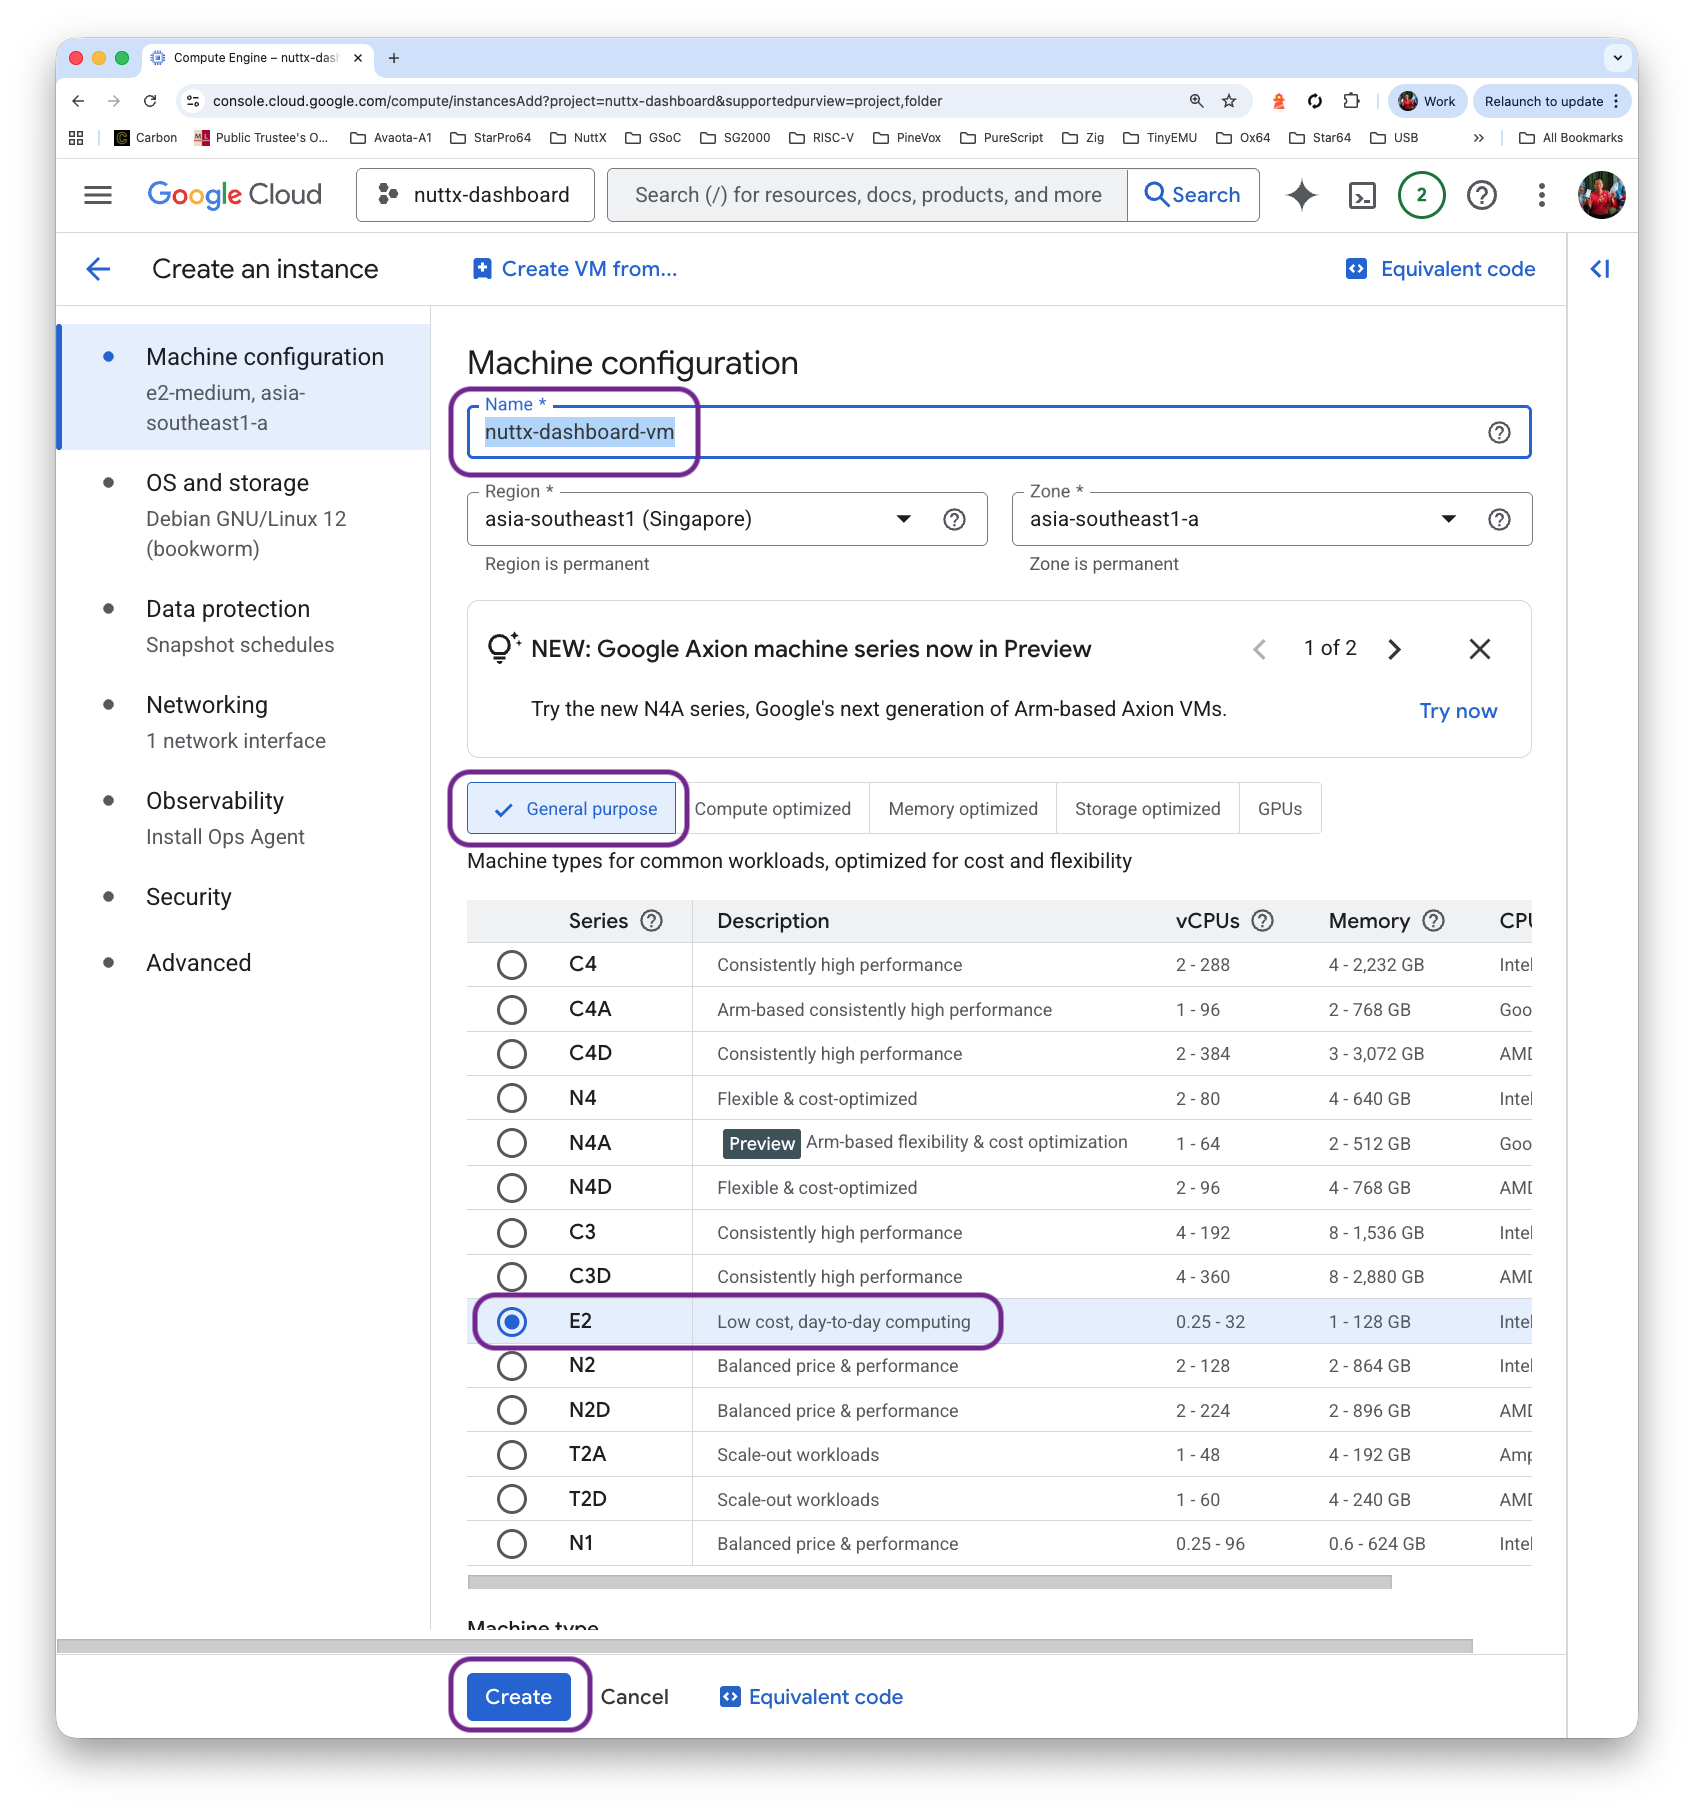
Fill in the Instance Name “nuttx-dashboard-vm”. Our VM shall be General Purpose / Debian Bookworm
Set the Disk Size to 80 GB (or expand it later)
Click “Create”
Click “Connect > SSH”
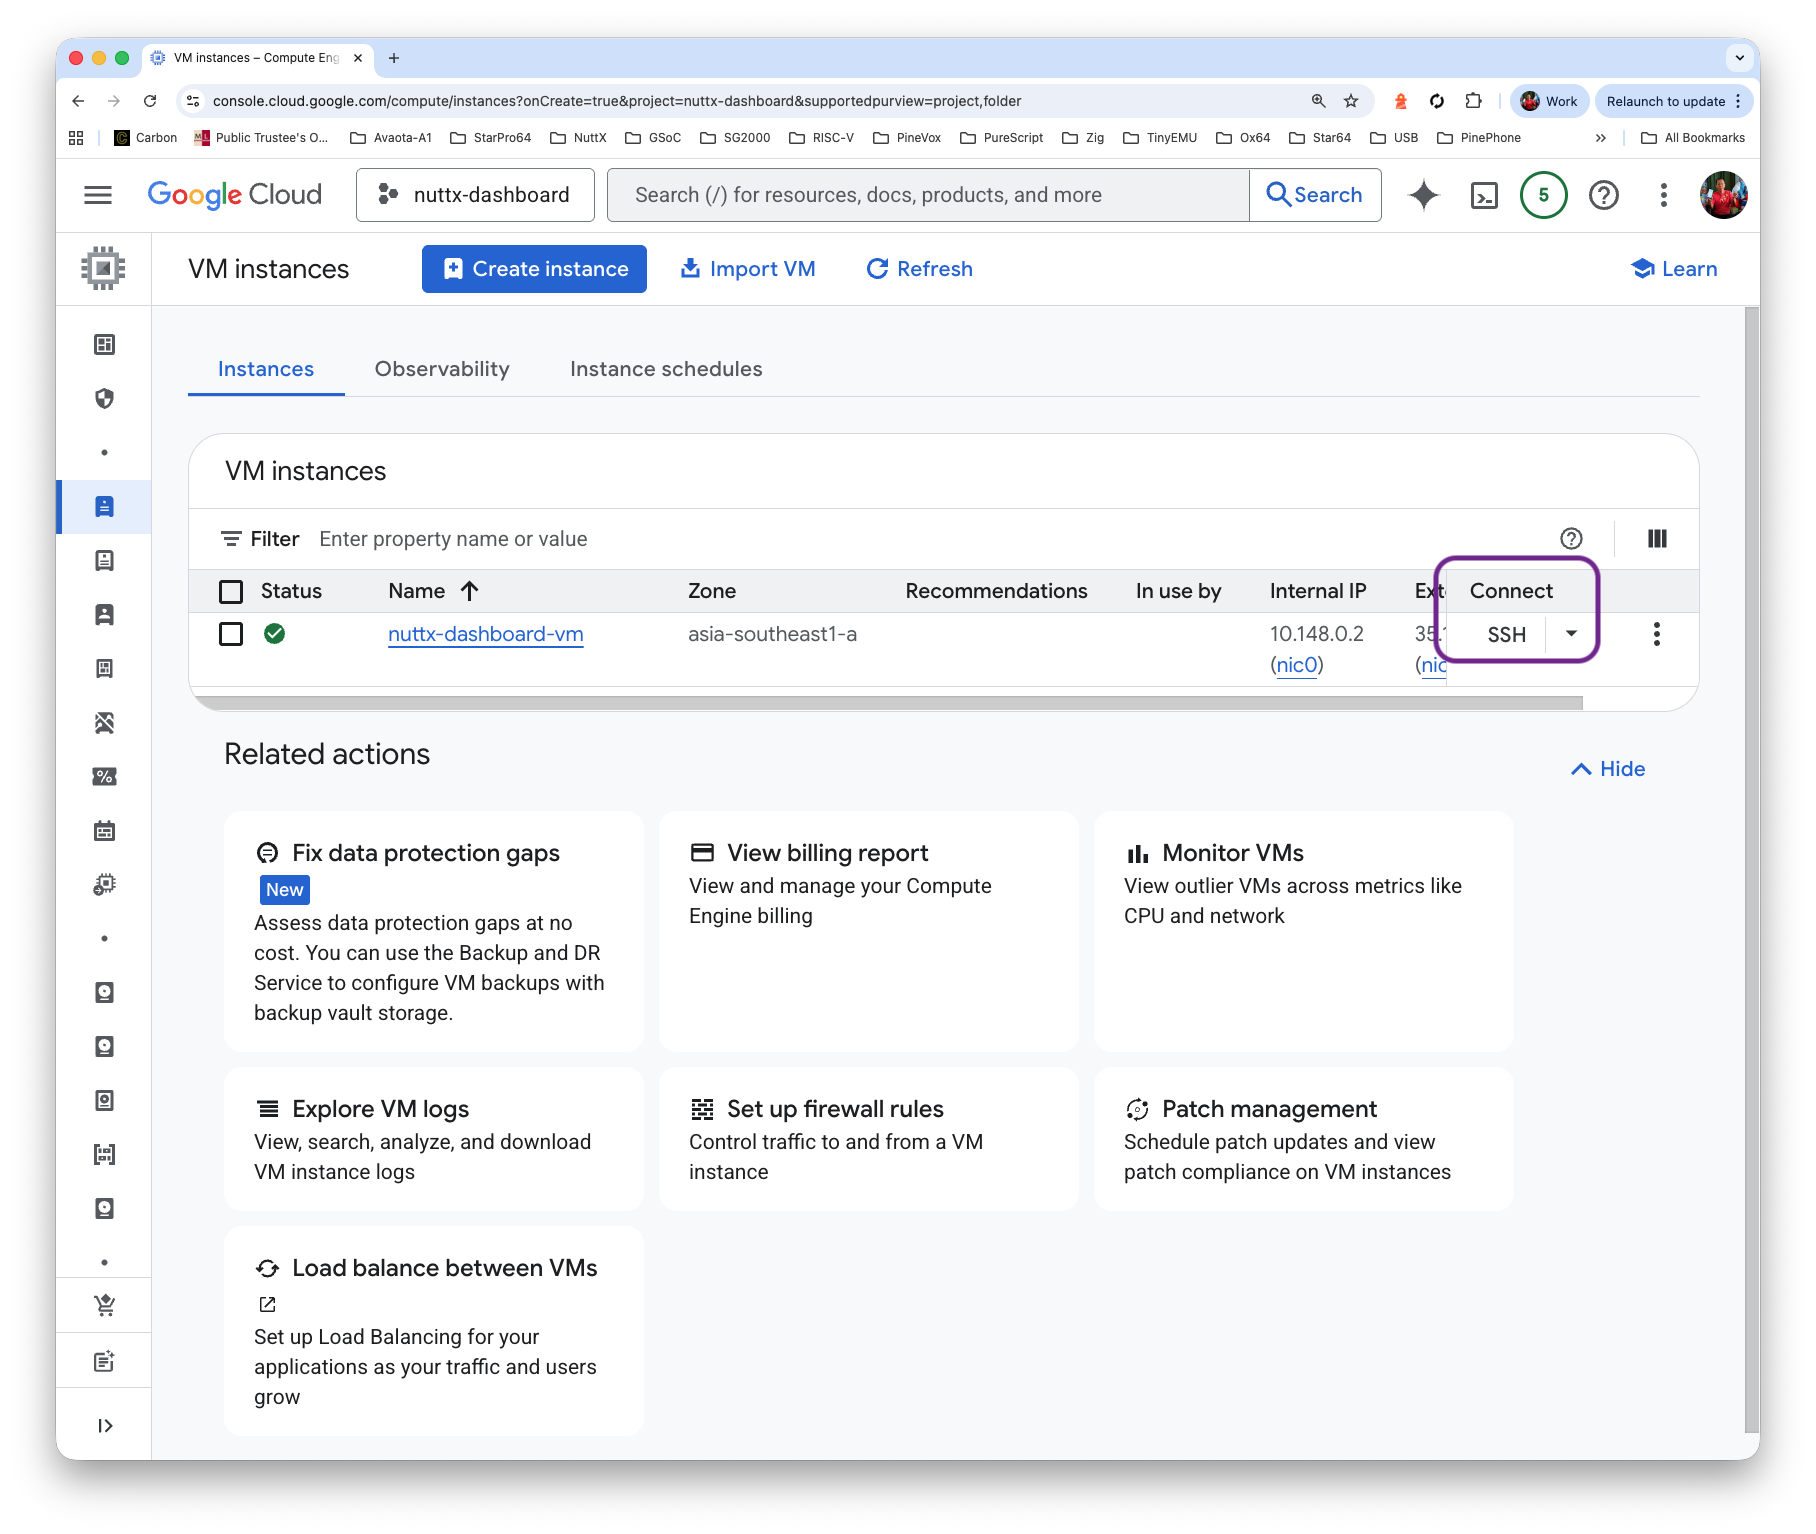
And SSH Console appears! Remember to Update and Upgrade the VM…
sudo apt update
sudo apt upgrade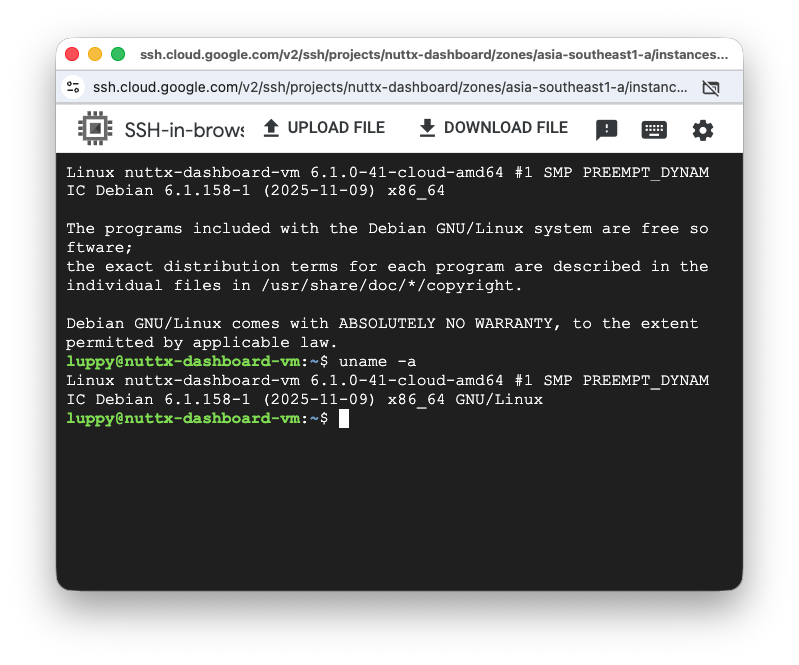
Is there a simpler way to access our VM?
Yep just use an SSH Key with VSCode Remote…
We’re ready to install Grafana OSS Server! Yep the thingy (pic above) that renders our NuttX Dashboard…
## Grafana OSS from https://apt.grafana.com (stable)
## Install the prerequisite packages
sudo apt-get install -y apt-transport-https wget

## Import the GPG key
sudo mkdir -p /etc/apt/keyrings/
wget -q -O - https://apt.grafana.com/gpg.key | gpg --dearmor | sudo tee /etc/apt/keyrings/grafana.gpg > /dev/null

## Add a repository for stable releases
echo "deb [signed-by=/etc/apt/keyrings/grafana.gpg] https://apt.grafana.com stable main" | sudo tee -a /etc/apt/sources.list.d/grafana.list

## Update the list of available packages
sudo apt-get update

## Install the latest OSS release
sudo apt-get install grafana

## Configure grafana to start automatically using systemd
sudo /bin/systemctl daemon-reload
sudo /bin/systemctl enable grafana-server

## Start grafana-server
sudo /bin/systemctl start grafana-server

## Grafana Server is listening on http://localhost:3000
## "tcp6 0 0 :::3000 :::* LISTEN"
netstat -an | grep LISTEN
How to access Grafana Server?
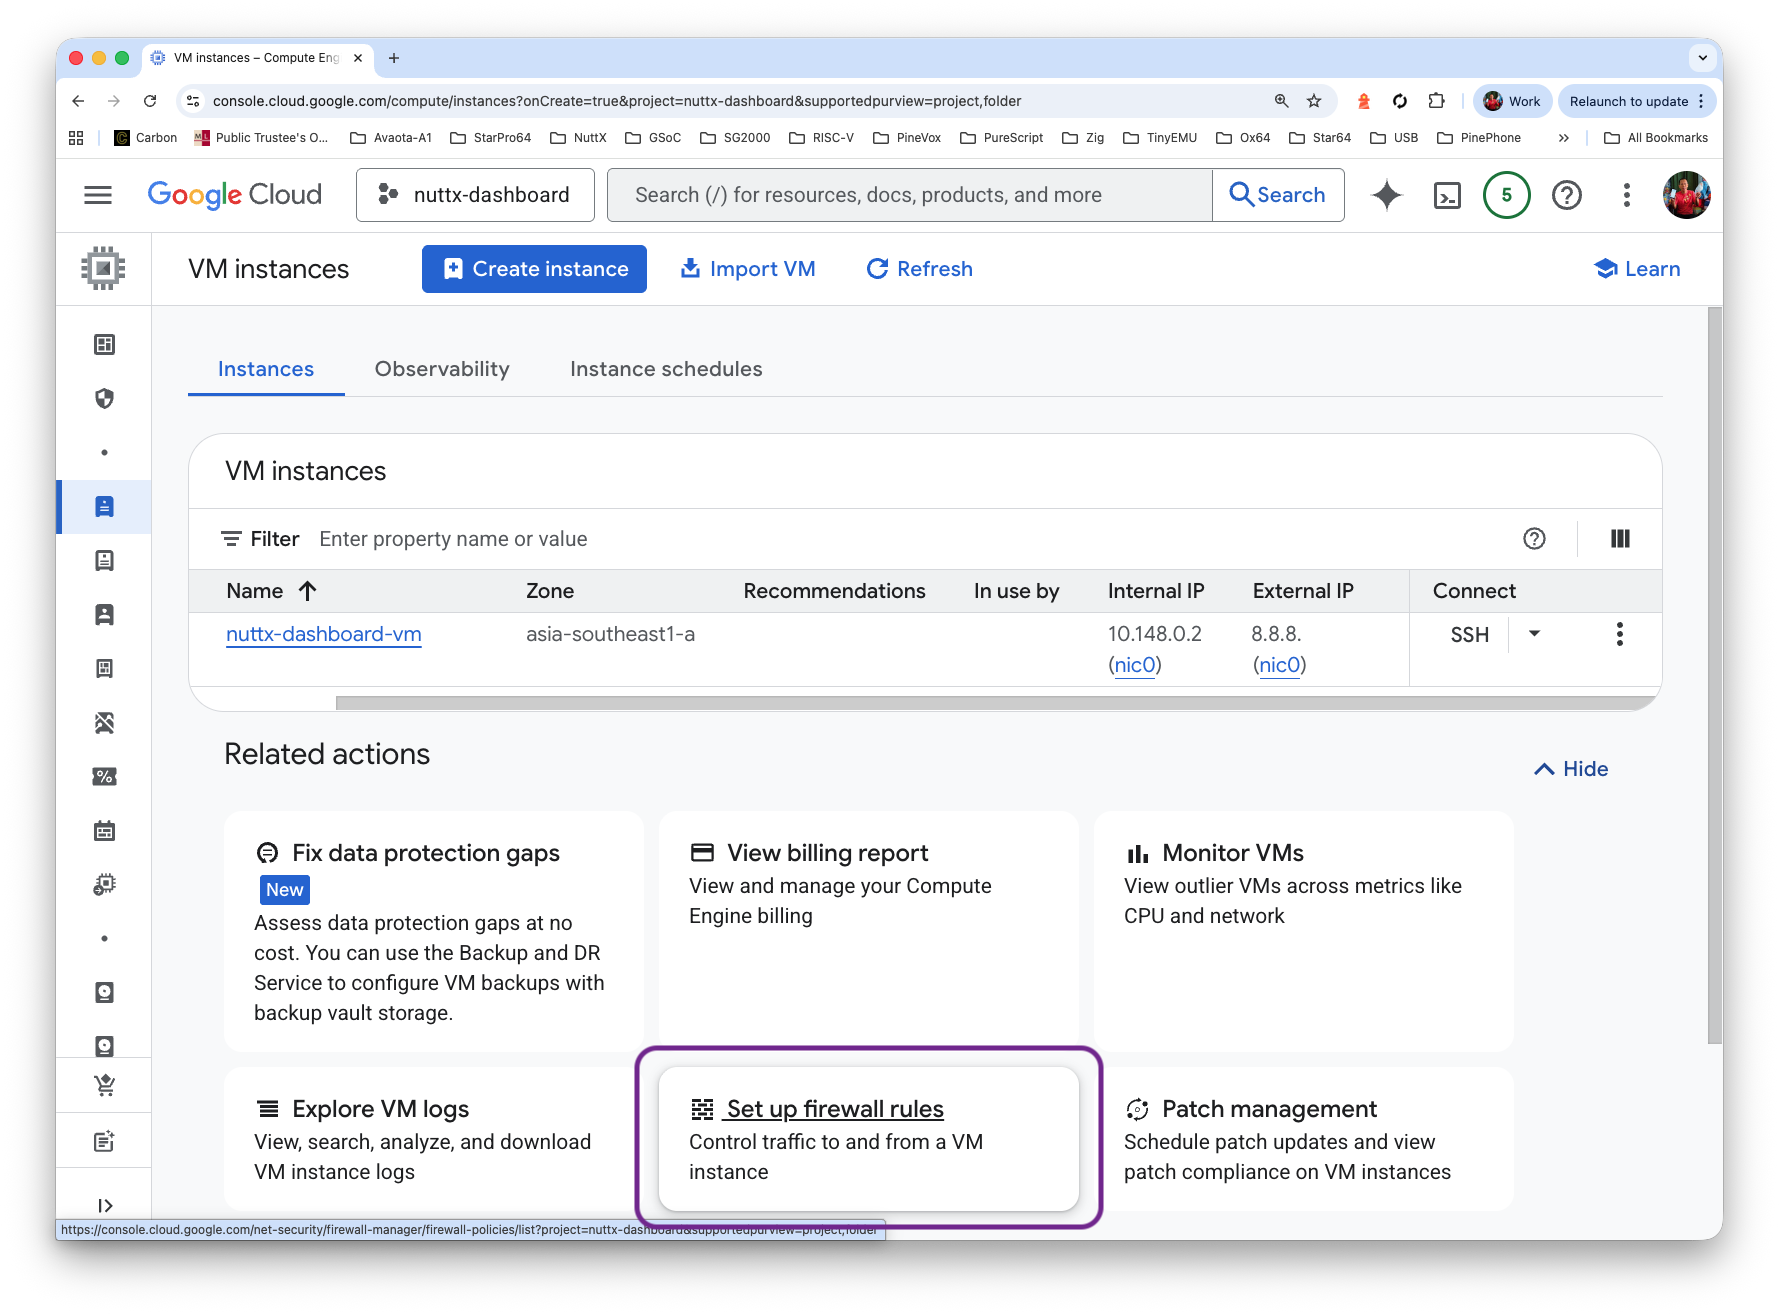
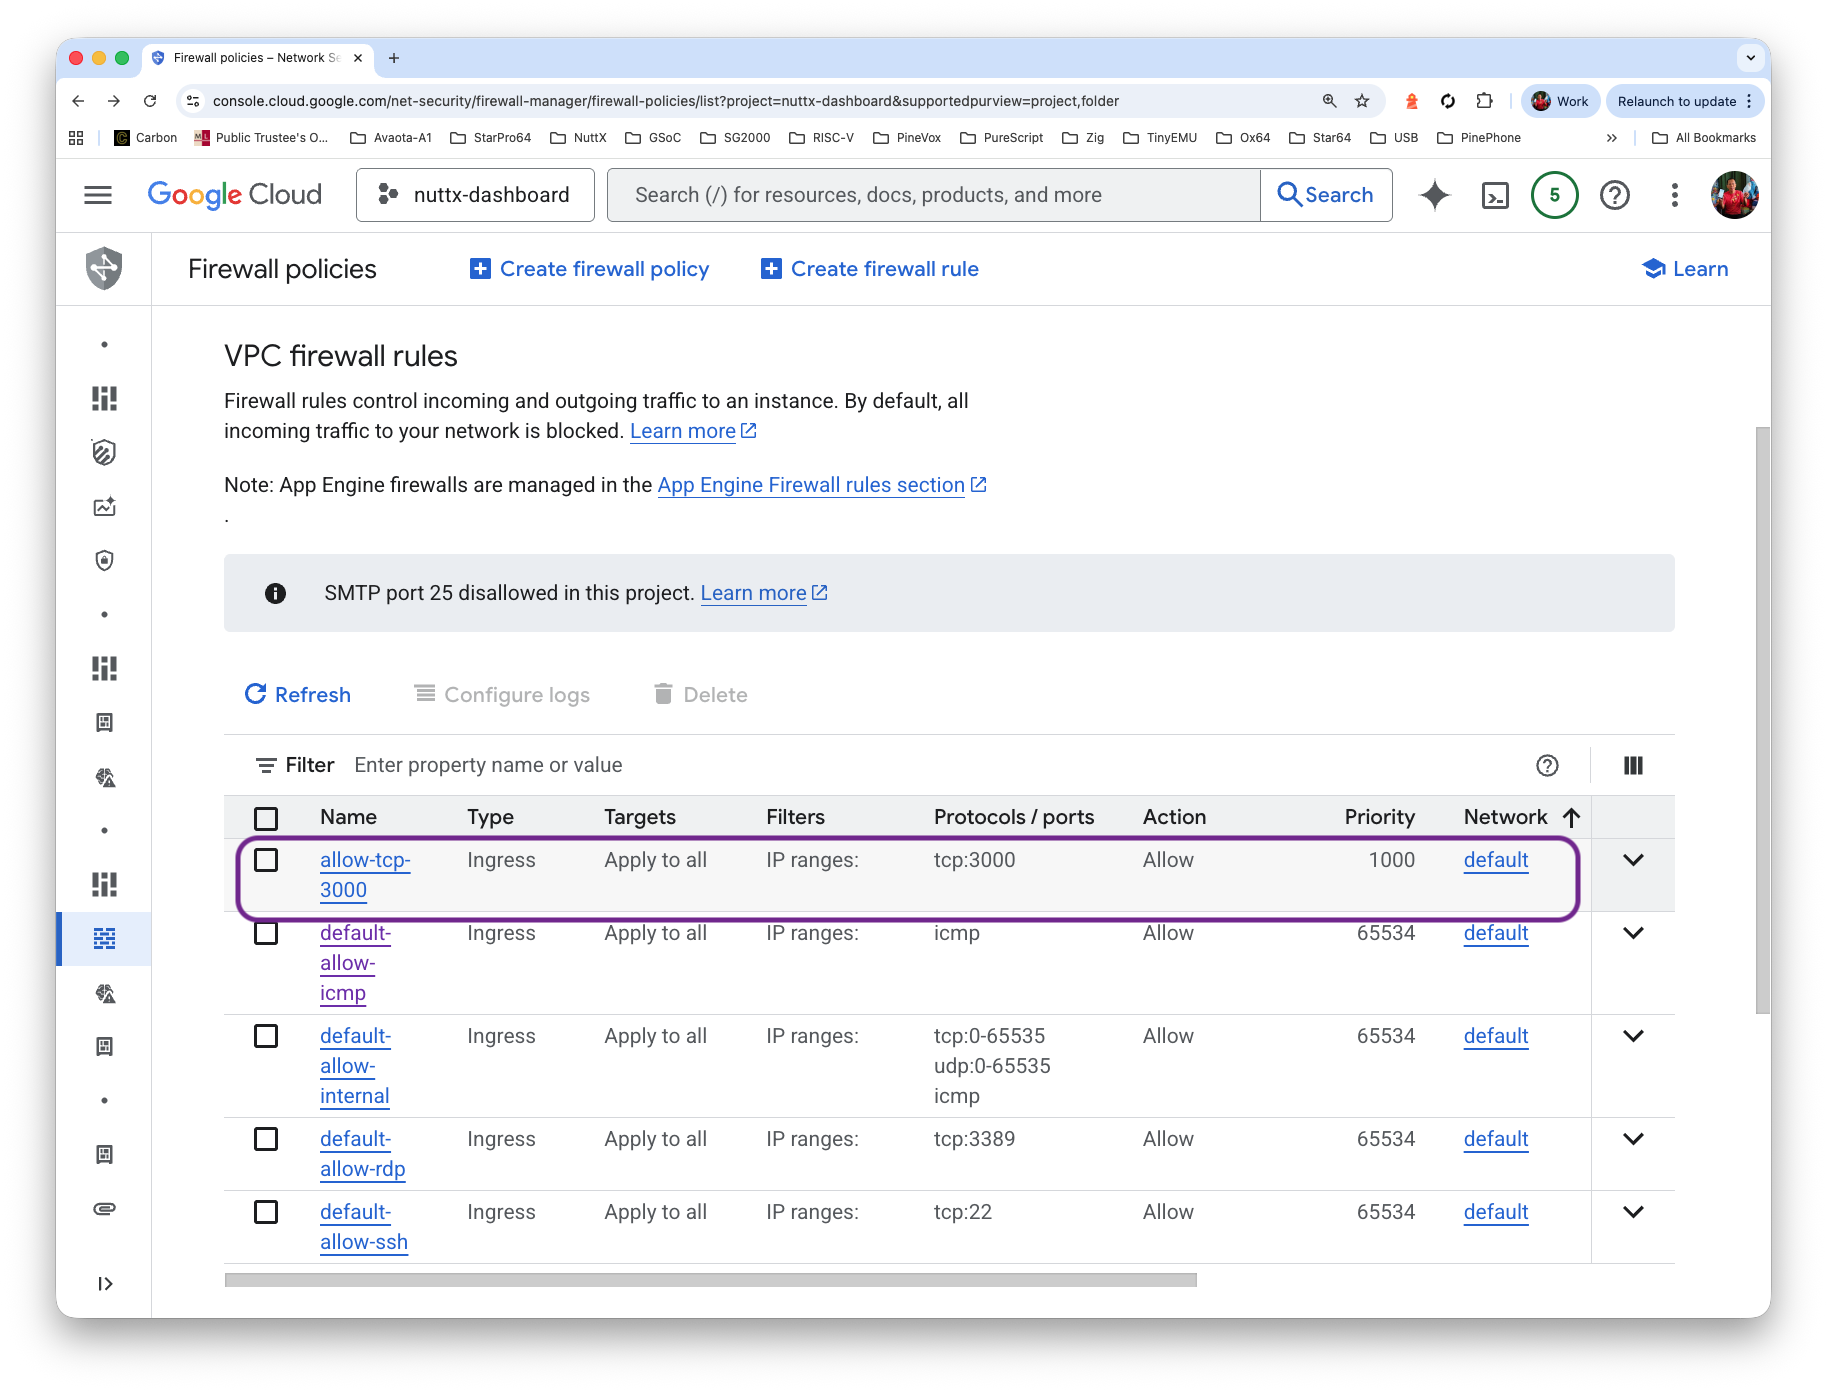
Grafana is listening at TCP Port 3000. We create a Firewall Rule to allow incoming packets for Port 3000…
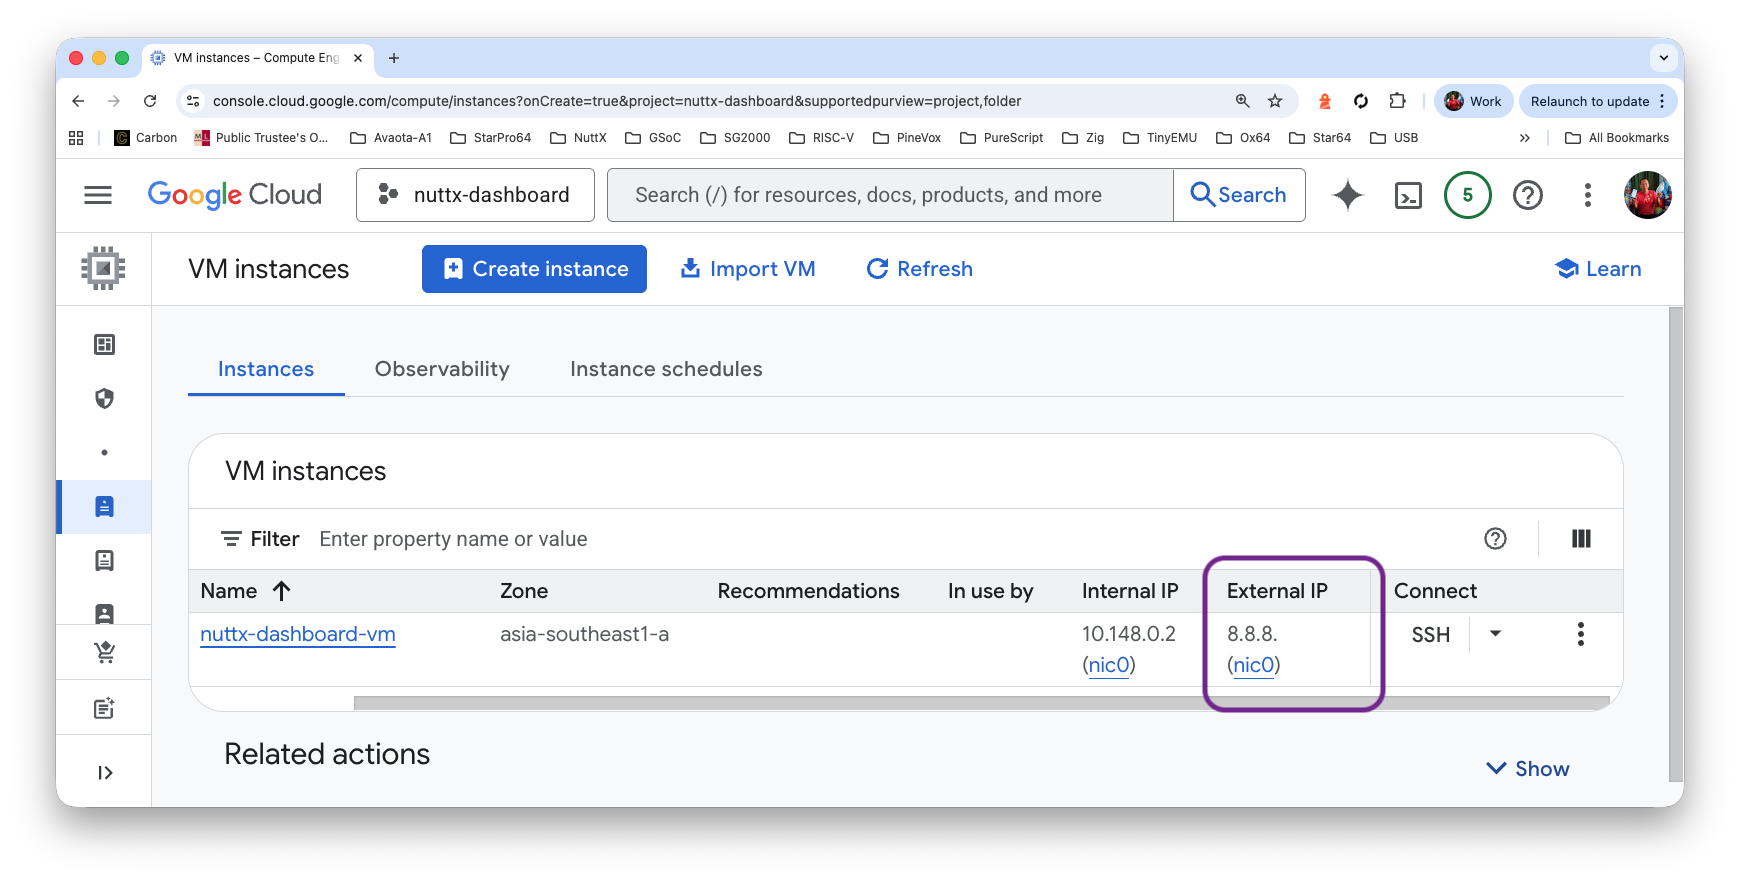
Grab the External IP Address for our VM…
VM Instance > External IP
Allow Incoming Packets for TCP Port 3000…
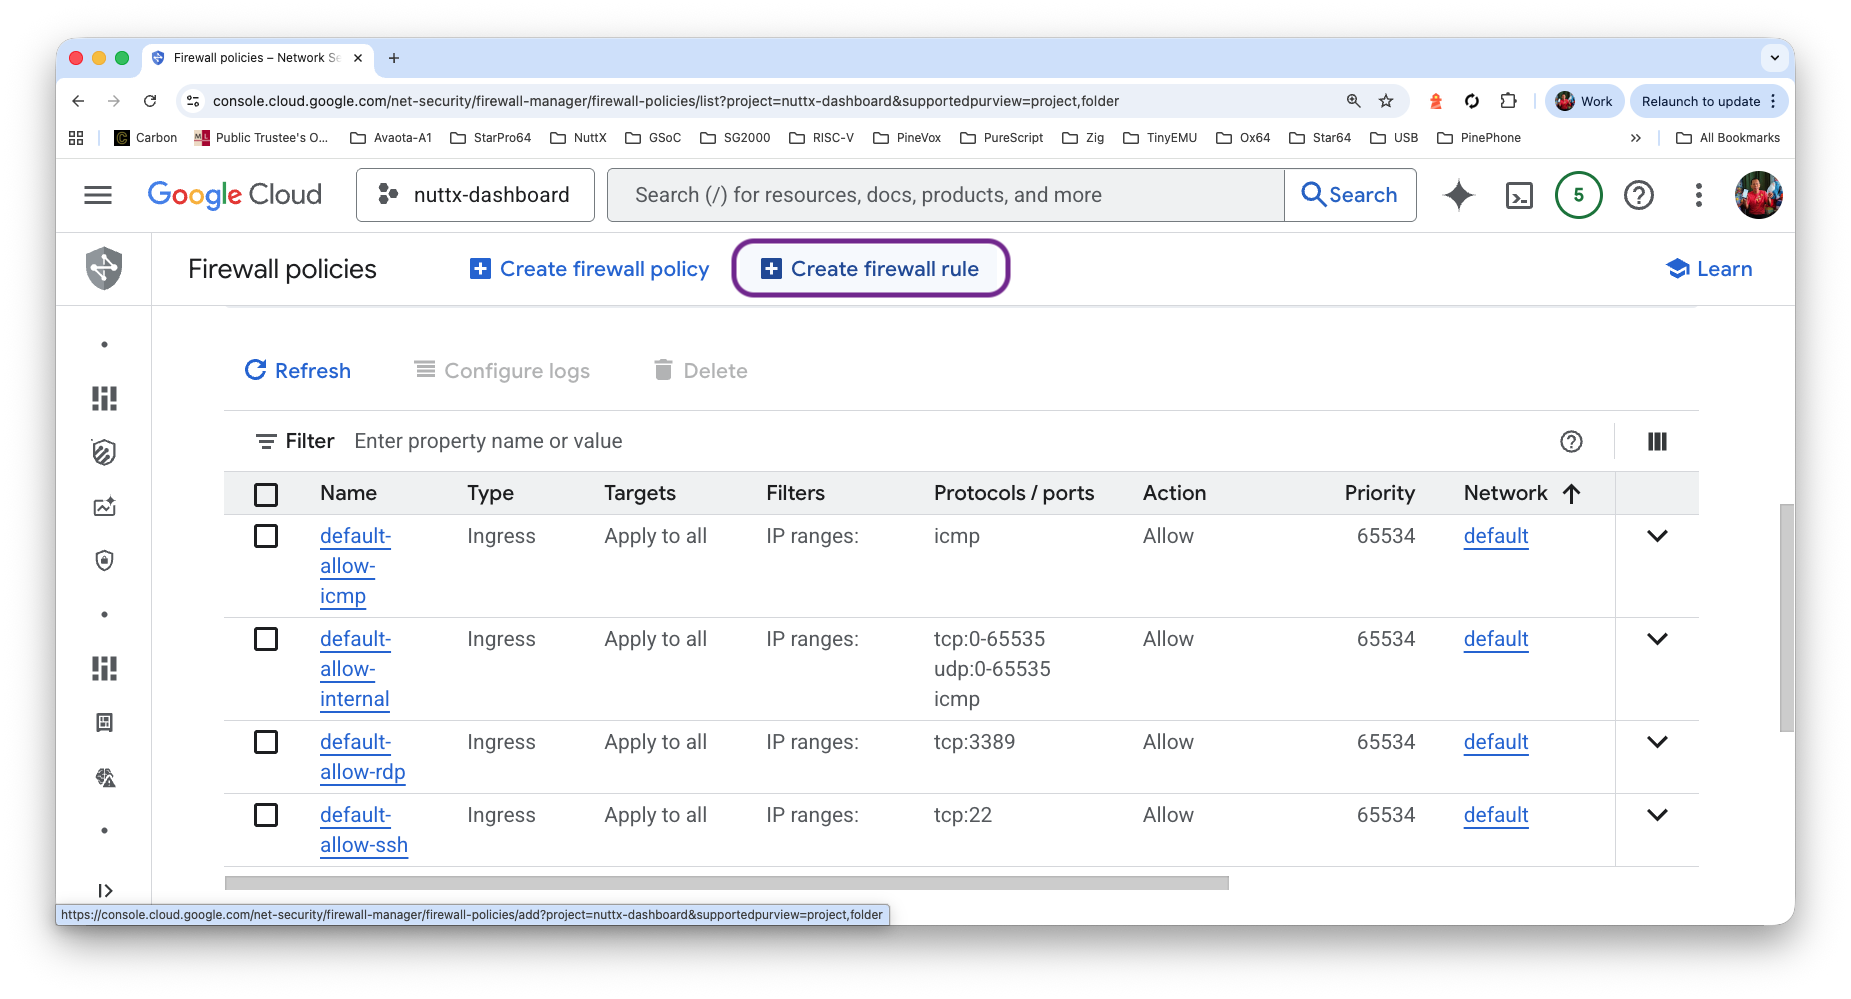
Click VM Instance > Set Up Firewall Rules
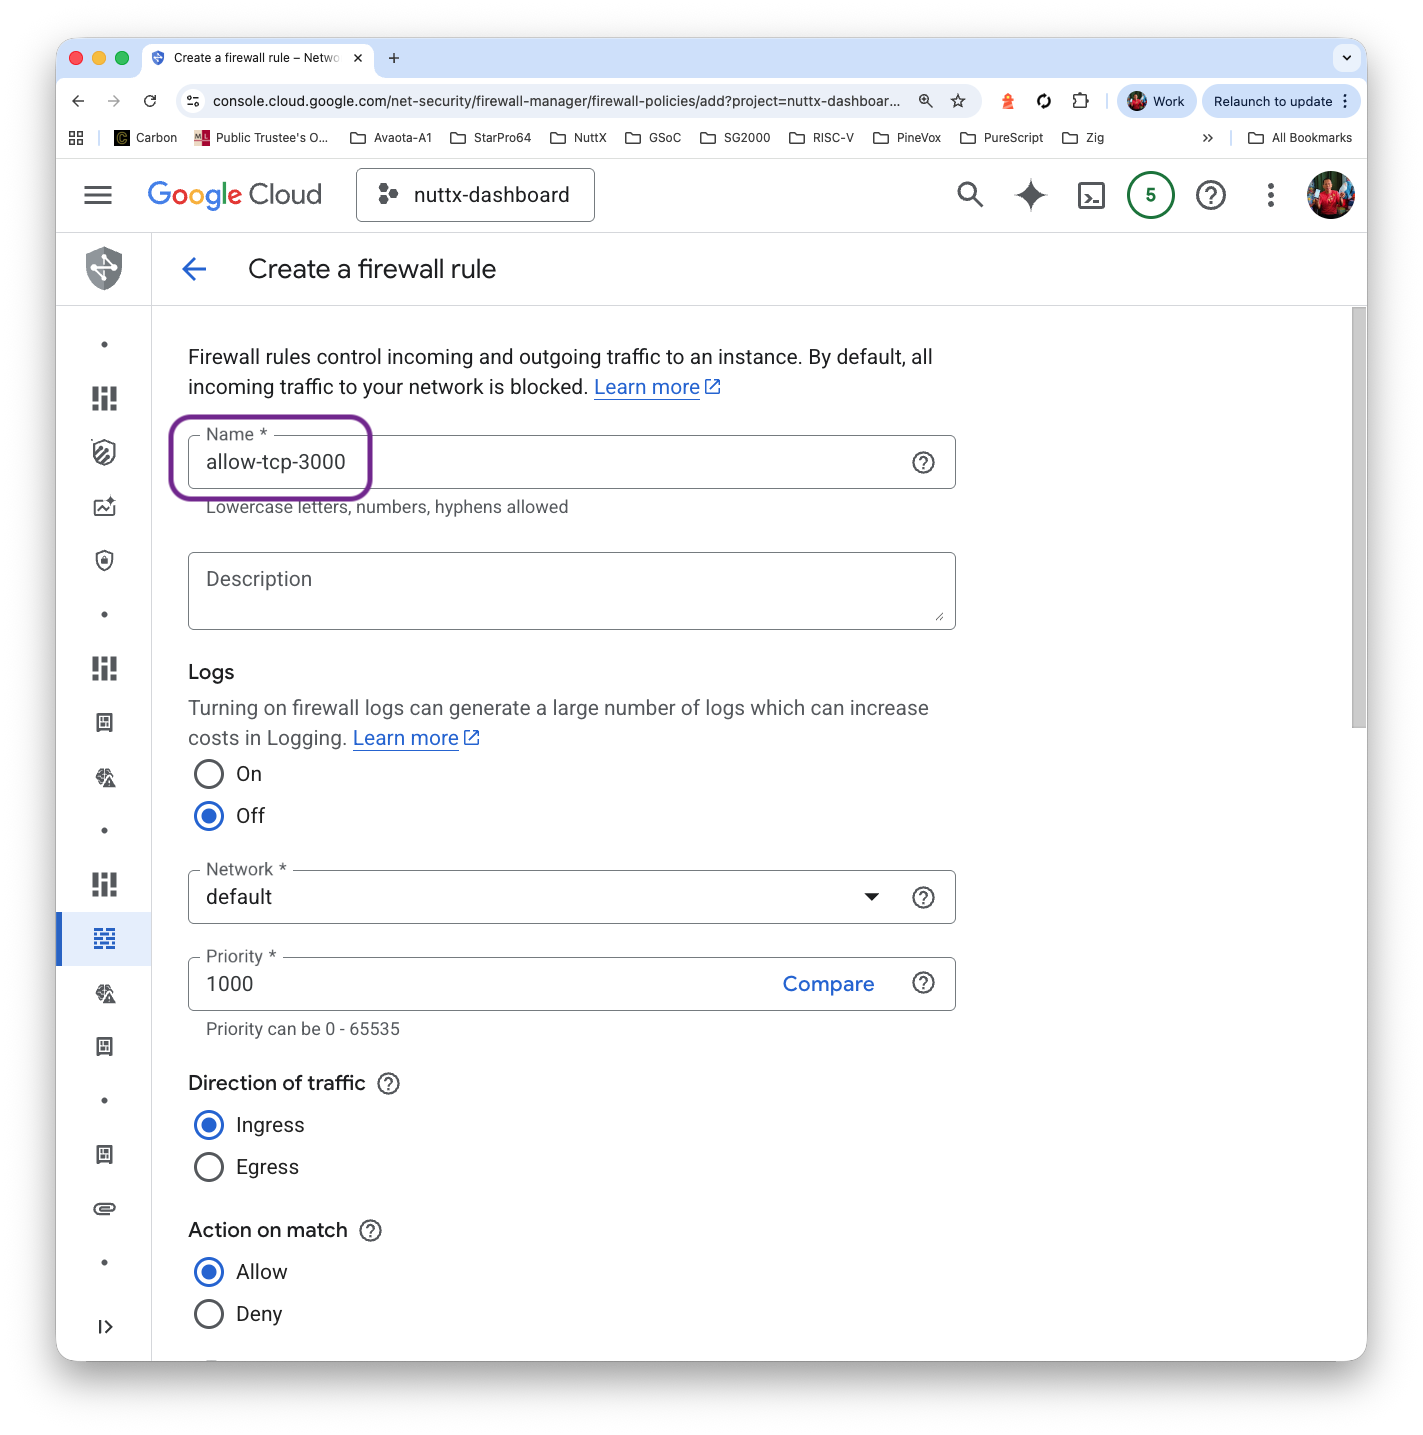
Click Firewall Policies > Create Firewall Rule
Name: allow-tcp-3000
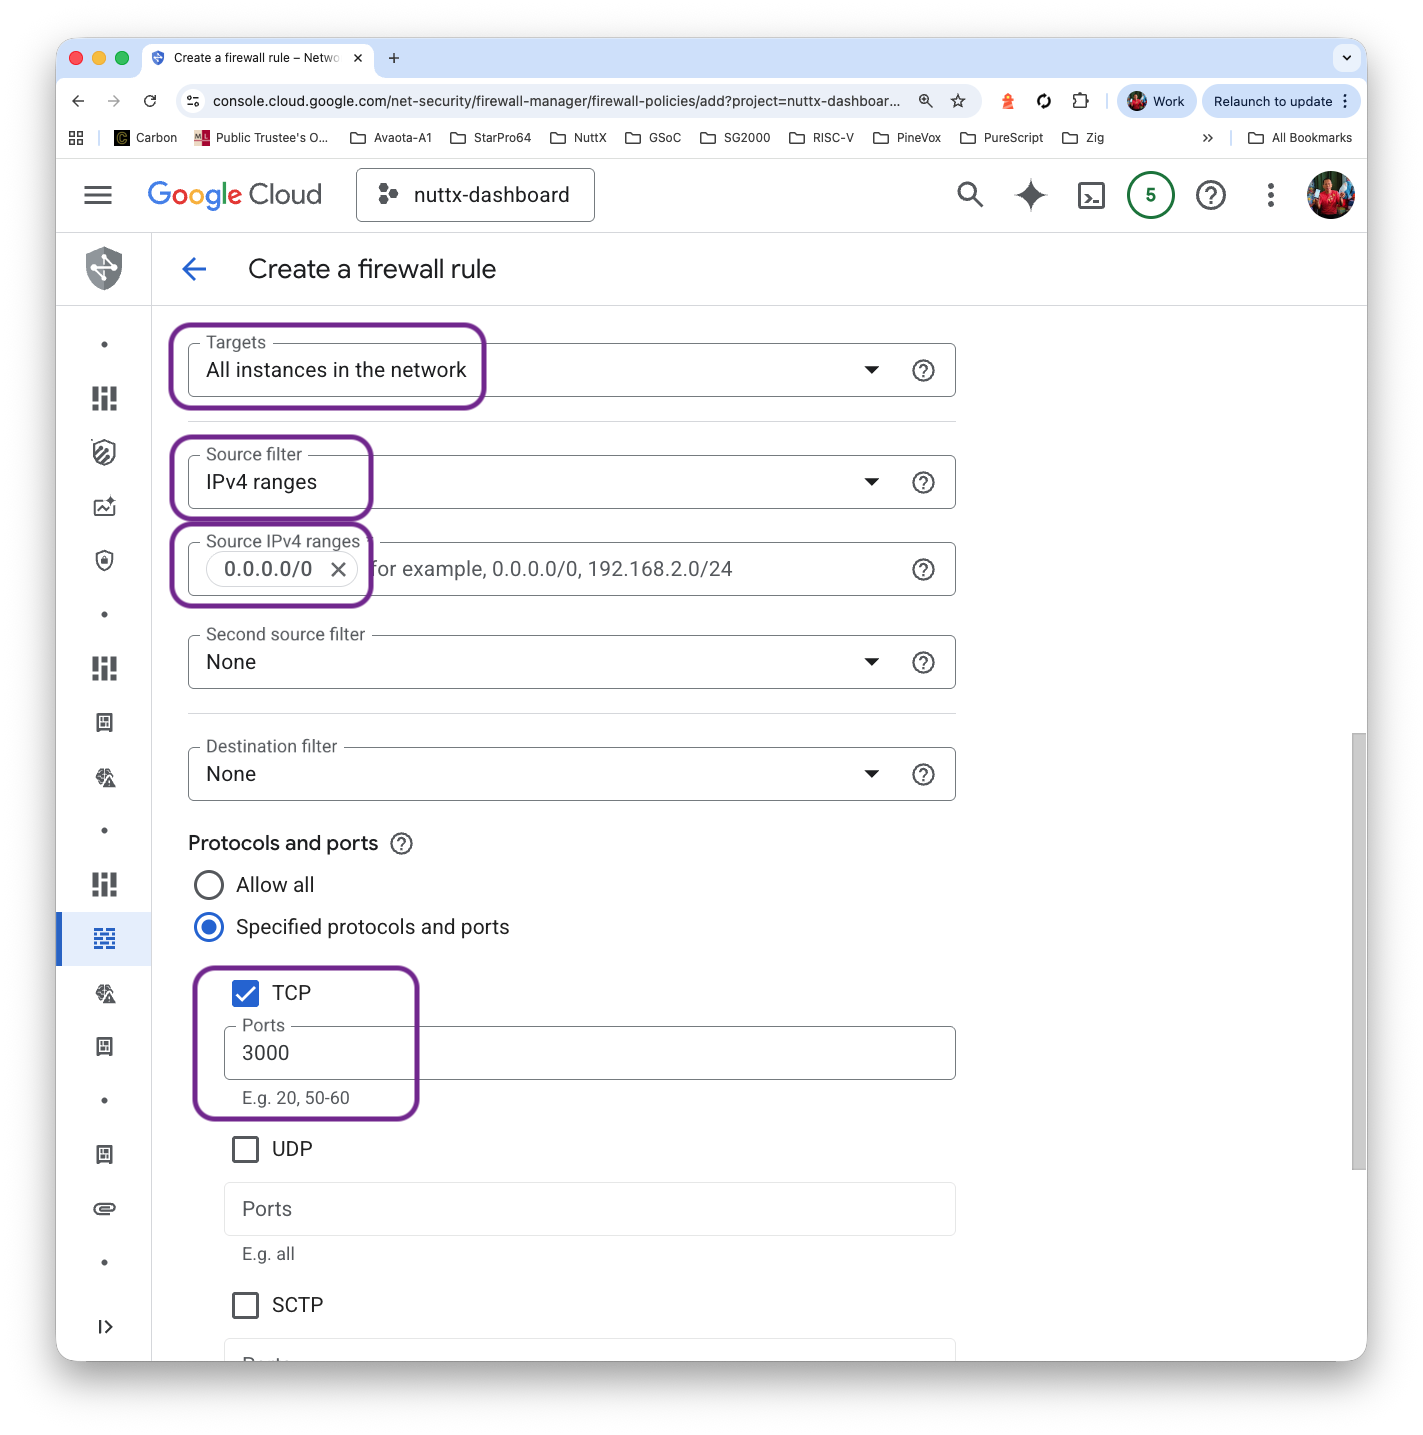
Targets: All instances in the network
IPv4 Ranges: 0.0.0.0/0
Protocol and Ports: TCP 3000
Click “Create”
Verify our Firewall Rule…
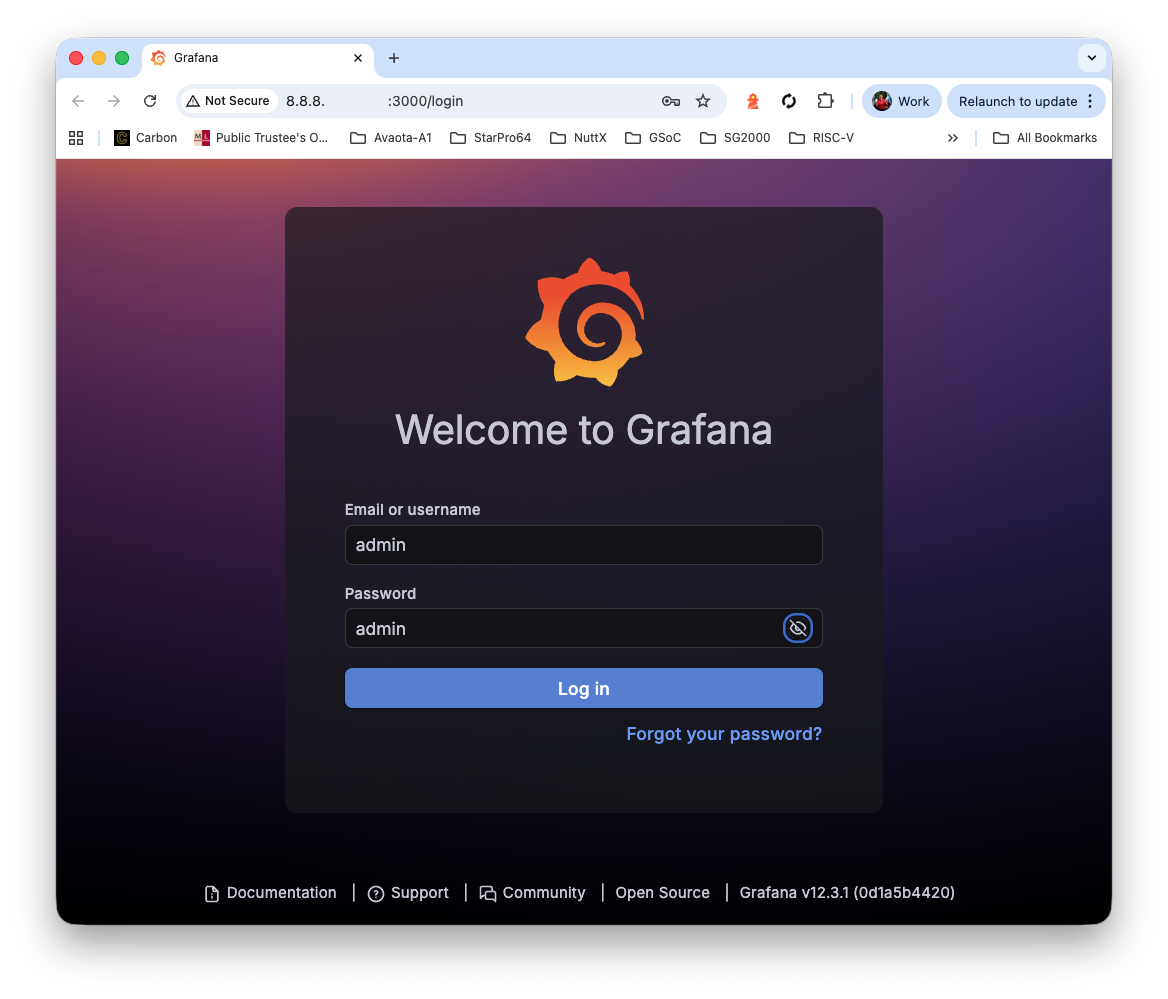
Browse to port 3000 of our External IP Address…
http://x.x.x.x:3000Username: admin
Password: admin
Set the new password
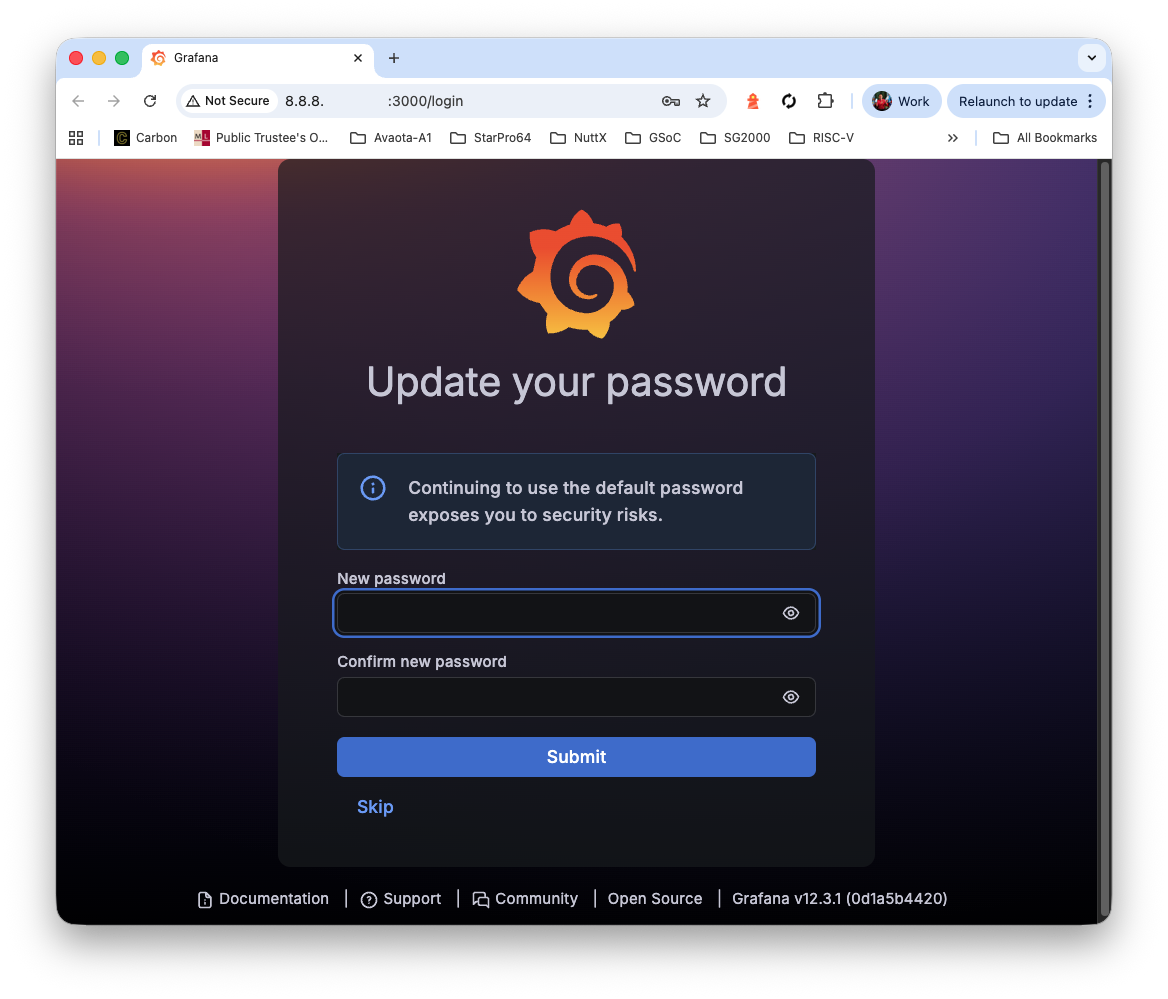
And we’re in Grafana!
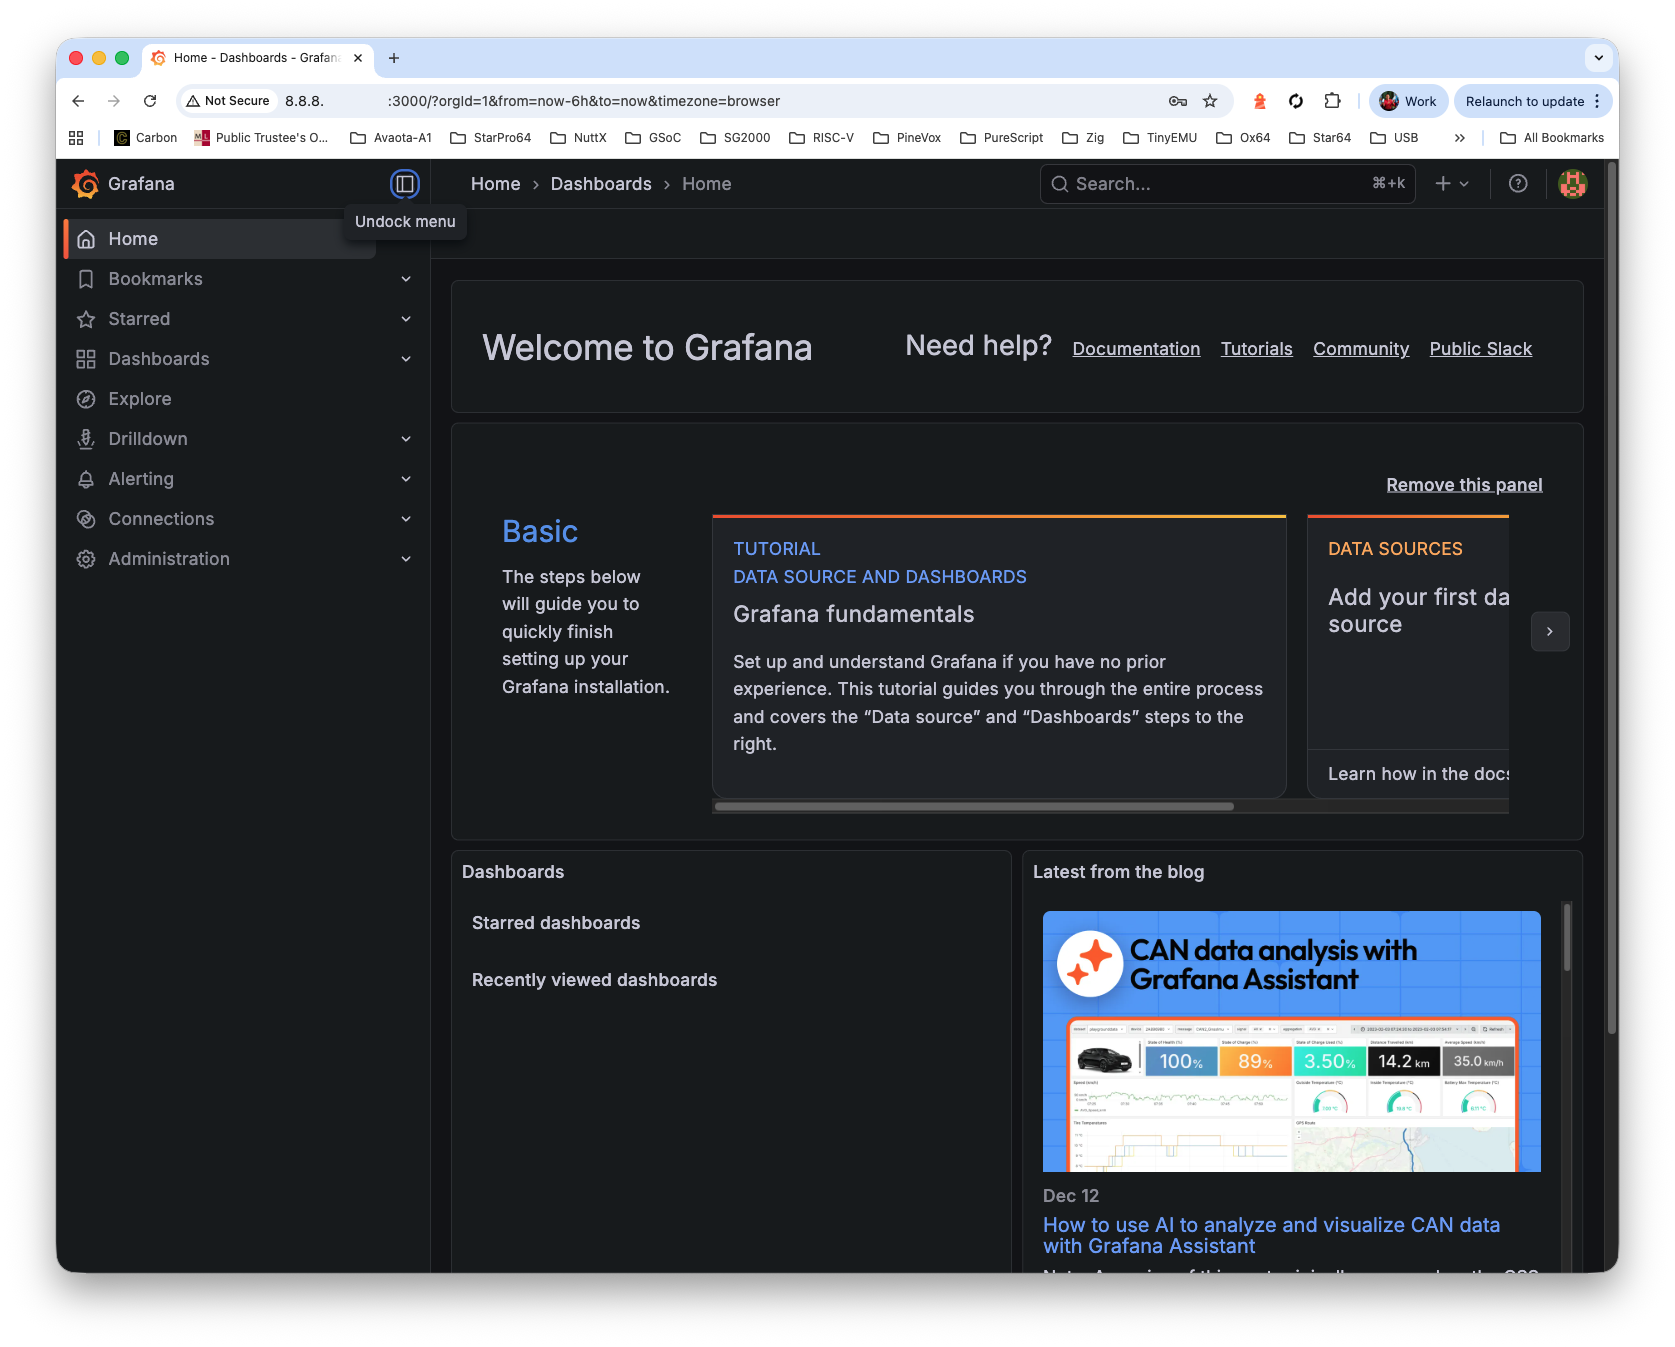
Our Grafana Dashboard needs data…
Where’s the data store for Grafana?
We’ll install Prometheus Time-Series Database (pic above), to record the successful and failed builds of NuttX across all 339 microcontroller boards…
## From https://ecintelligence.ma/en/blog/complete-guide-to-prometheus-and-grafana-monitorin/
## Install Prometheus Server
sudo apt install prometheus

## Start Prometheus Server on boot
sudo systemctl enable prometheus

## Start Prometheus Server right now
sudo systemctl start prometheus

## Check the status of Prometheus Server
sudo systemctl status prometheus

## We should see...
## ● prometheus.service - Monitoring system and time series database
## Loaded: loaded (/lib/systemd/system/prometheus.service; enabled; preset: enabled)
## Active: active (running)

## Verify that Prometheus is listening on TCP Port 9090
sudo ss -tlnp | grep -E '9090|9100'

## We should see...
## LISTEN 0 4096 *:9090 *:* users:(("prometheus",pid=93392,fd=7))
## LISTEN 0 4096 *:9100 *:* users:(("prometheus-node",pid=93237,fd=3))

## Later we'll configure Prometheus...
## /etc/prometheus/prometheus.yml
To see Prometheus: We create a Firewall Rule to allow incoming access to TCP Port 9090…
Click “VM Instance > Set Up Firewall Rules”
Click “Firewall Policies > Create Firewall Rule”
Name: allow-tcp-9090
Targets: All instances in the network
IPv4 Ranges: 0.0.0.0/0
Protocol and Ports: TCP 9090

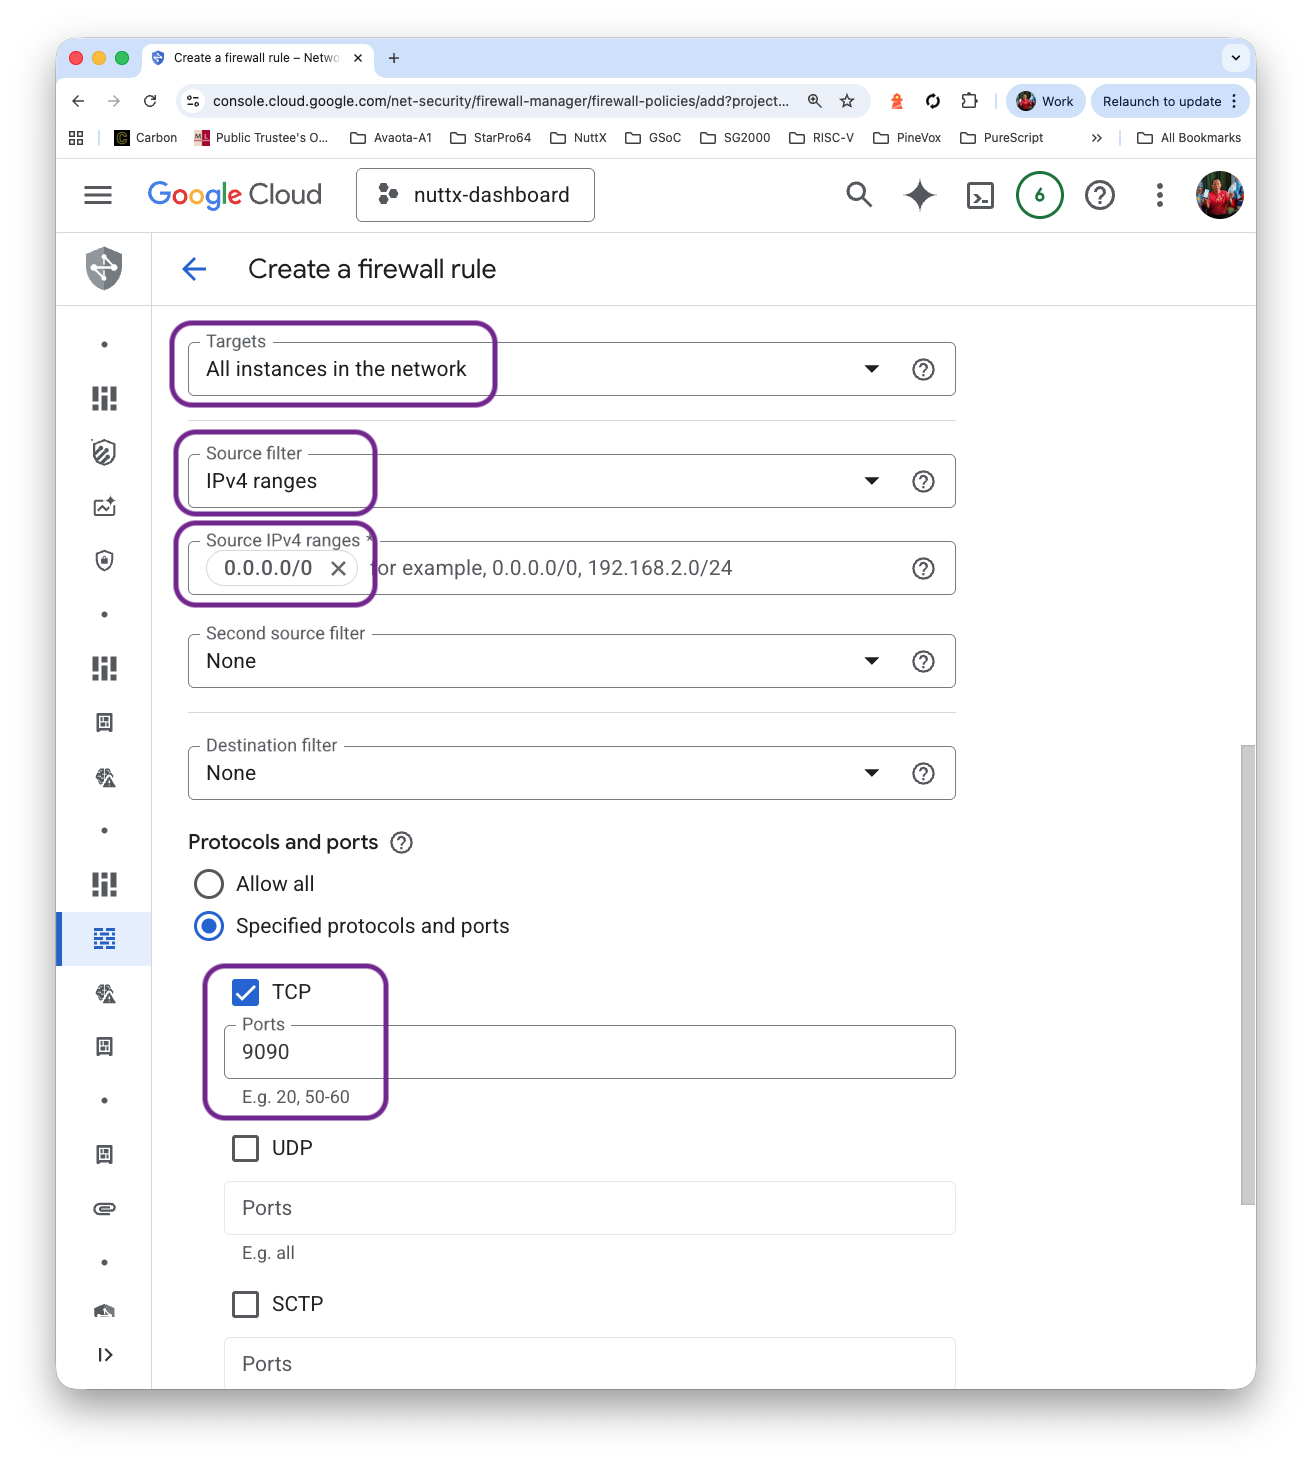
Click “Create”. Verify that Port 9090 is open…
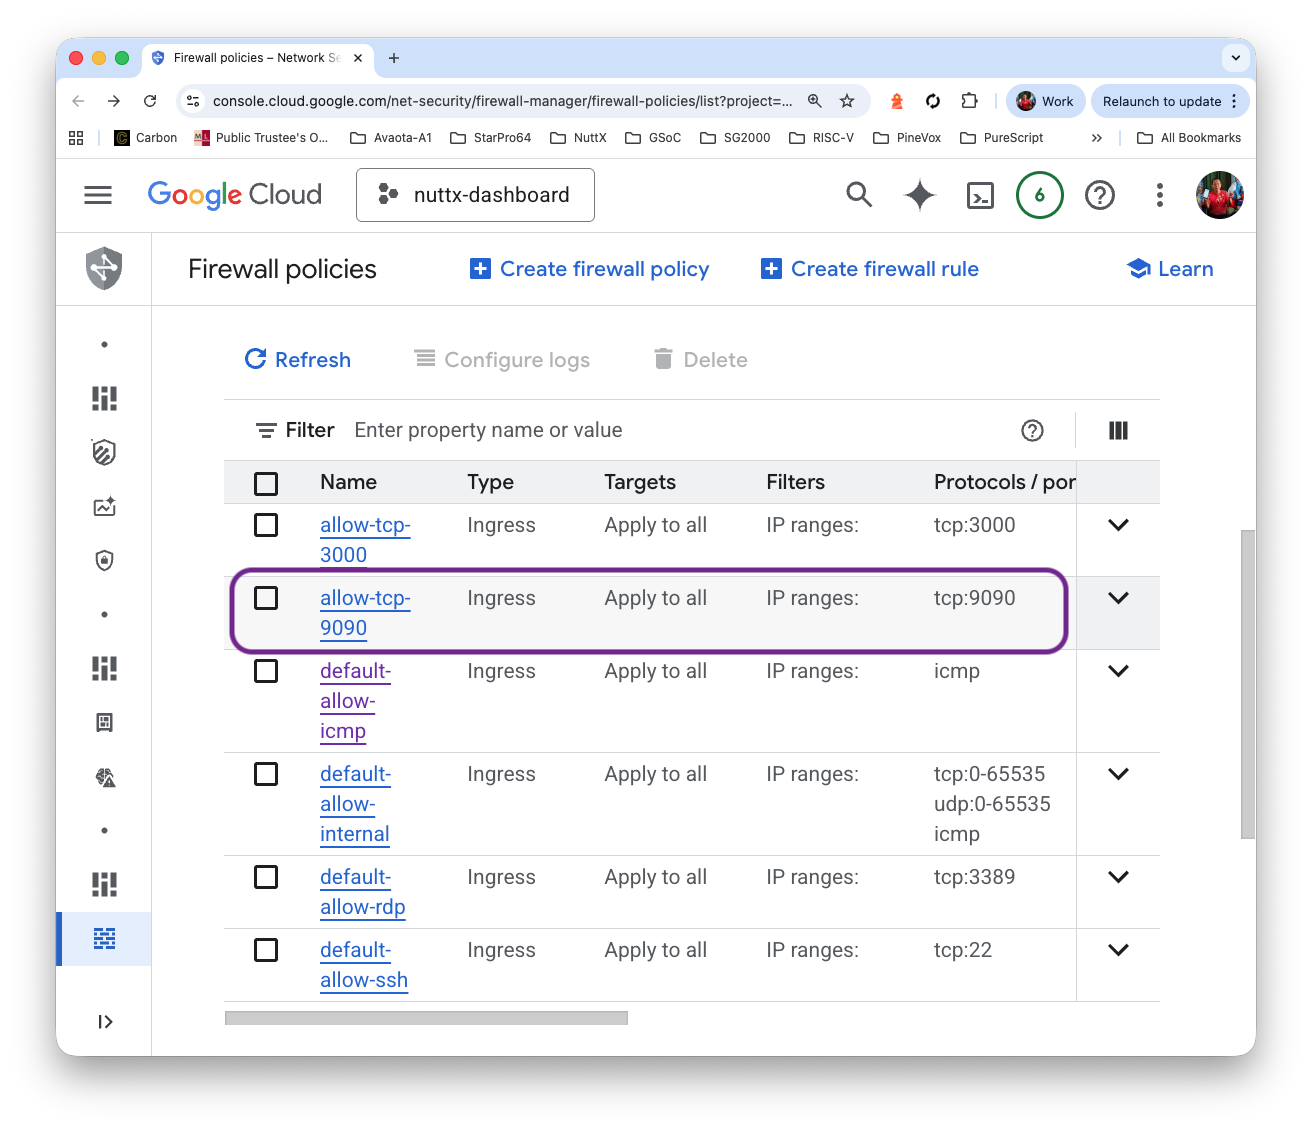
Prometheus appears when we browse to Port 9090 of our External IP Address…
http://x.x.x.x:9090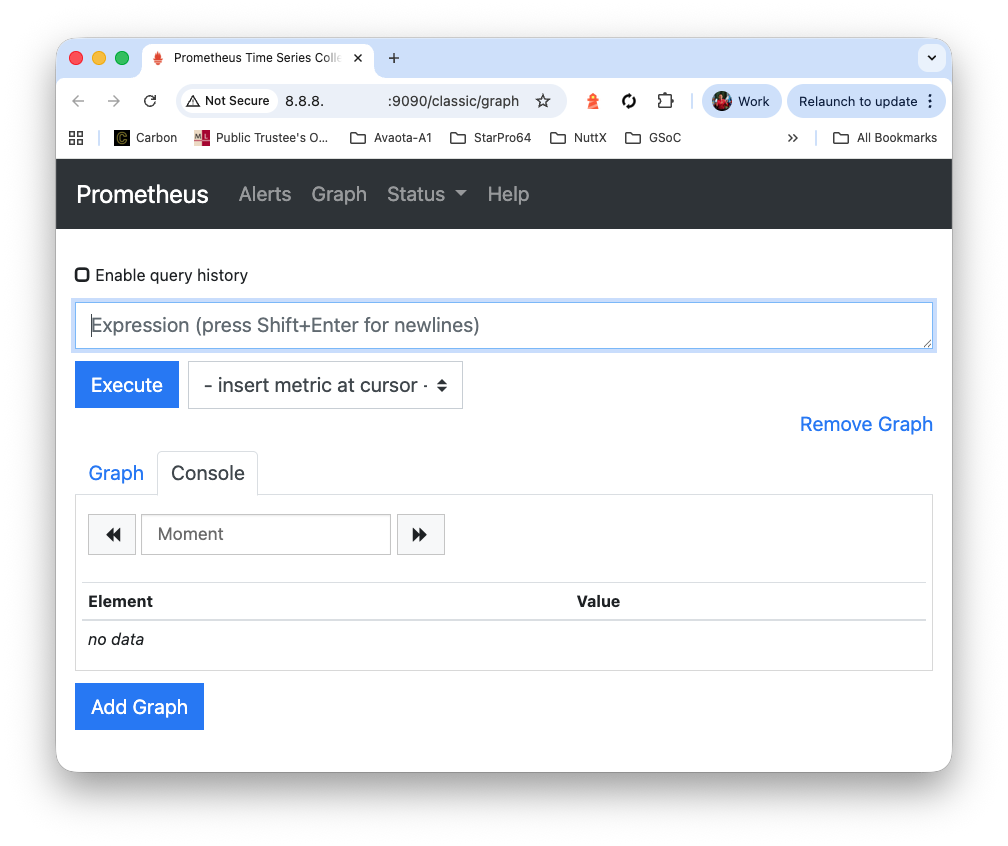
Why Prometheus? Why not SQL Database?
Remember we got Zero Budget for hosting NuttX Dashboard? Prometheus seems to be the Cheapest Way of hosting Time-Series Data.
What’s this Prometheus Pushgateway?
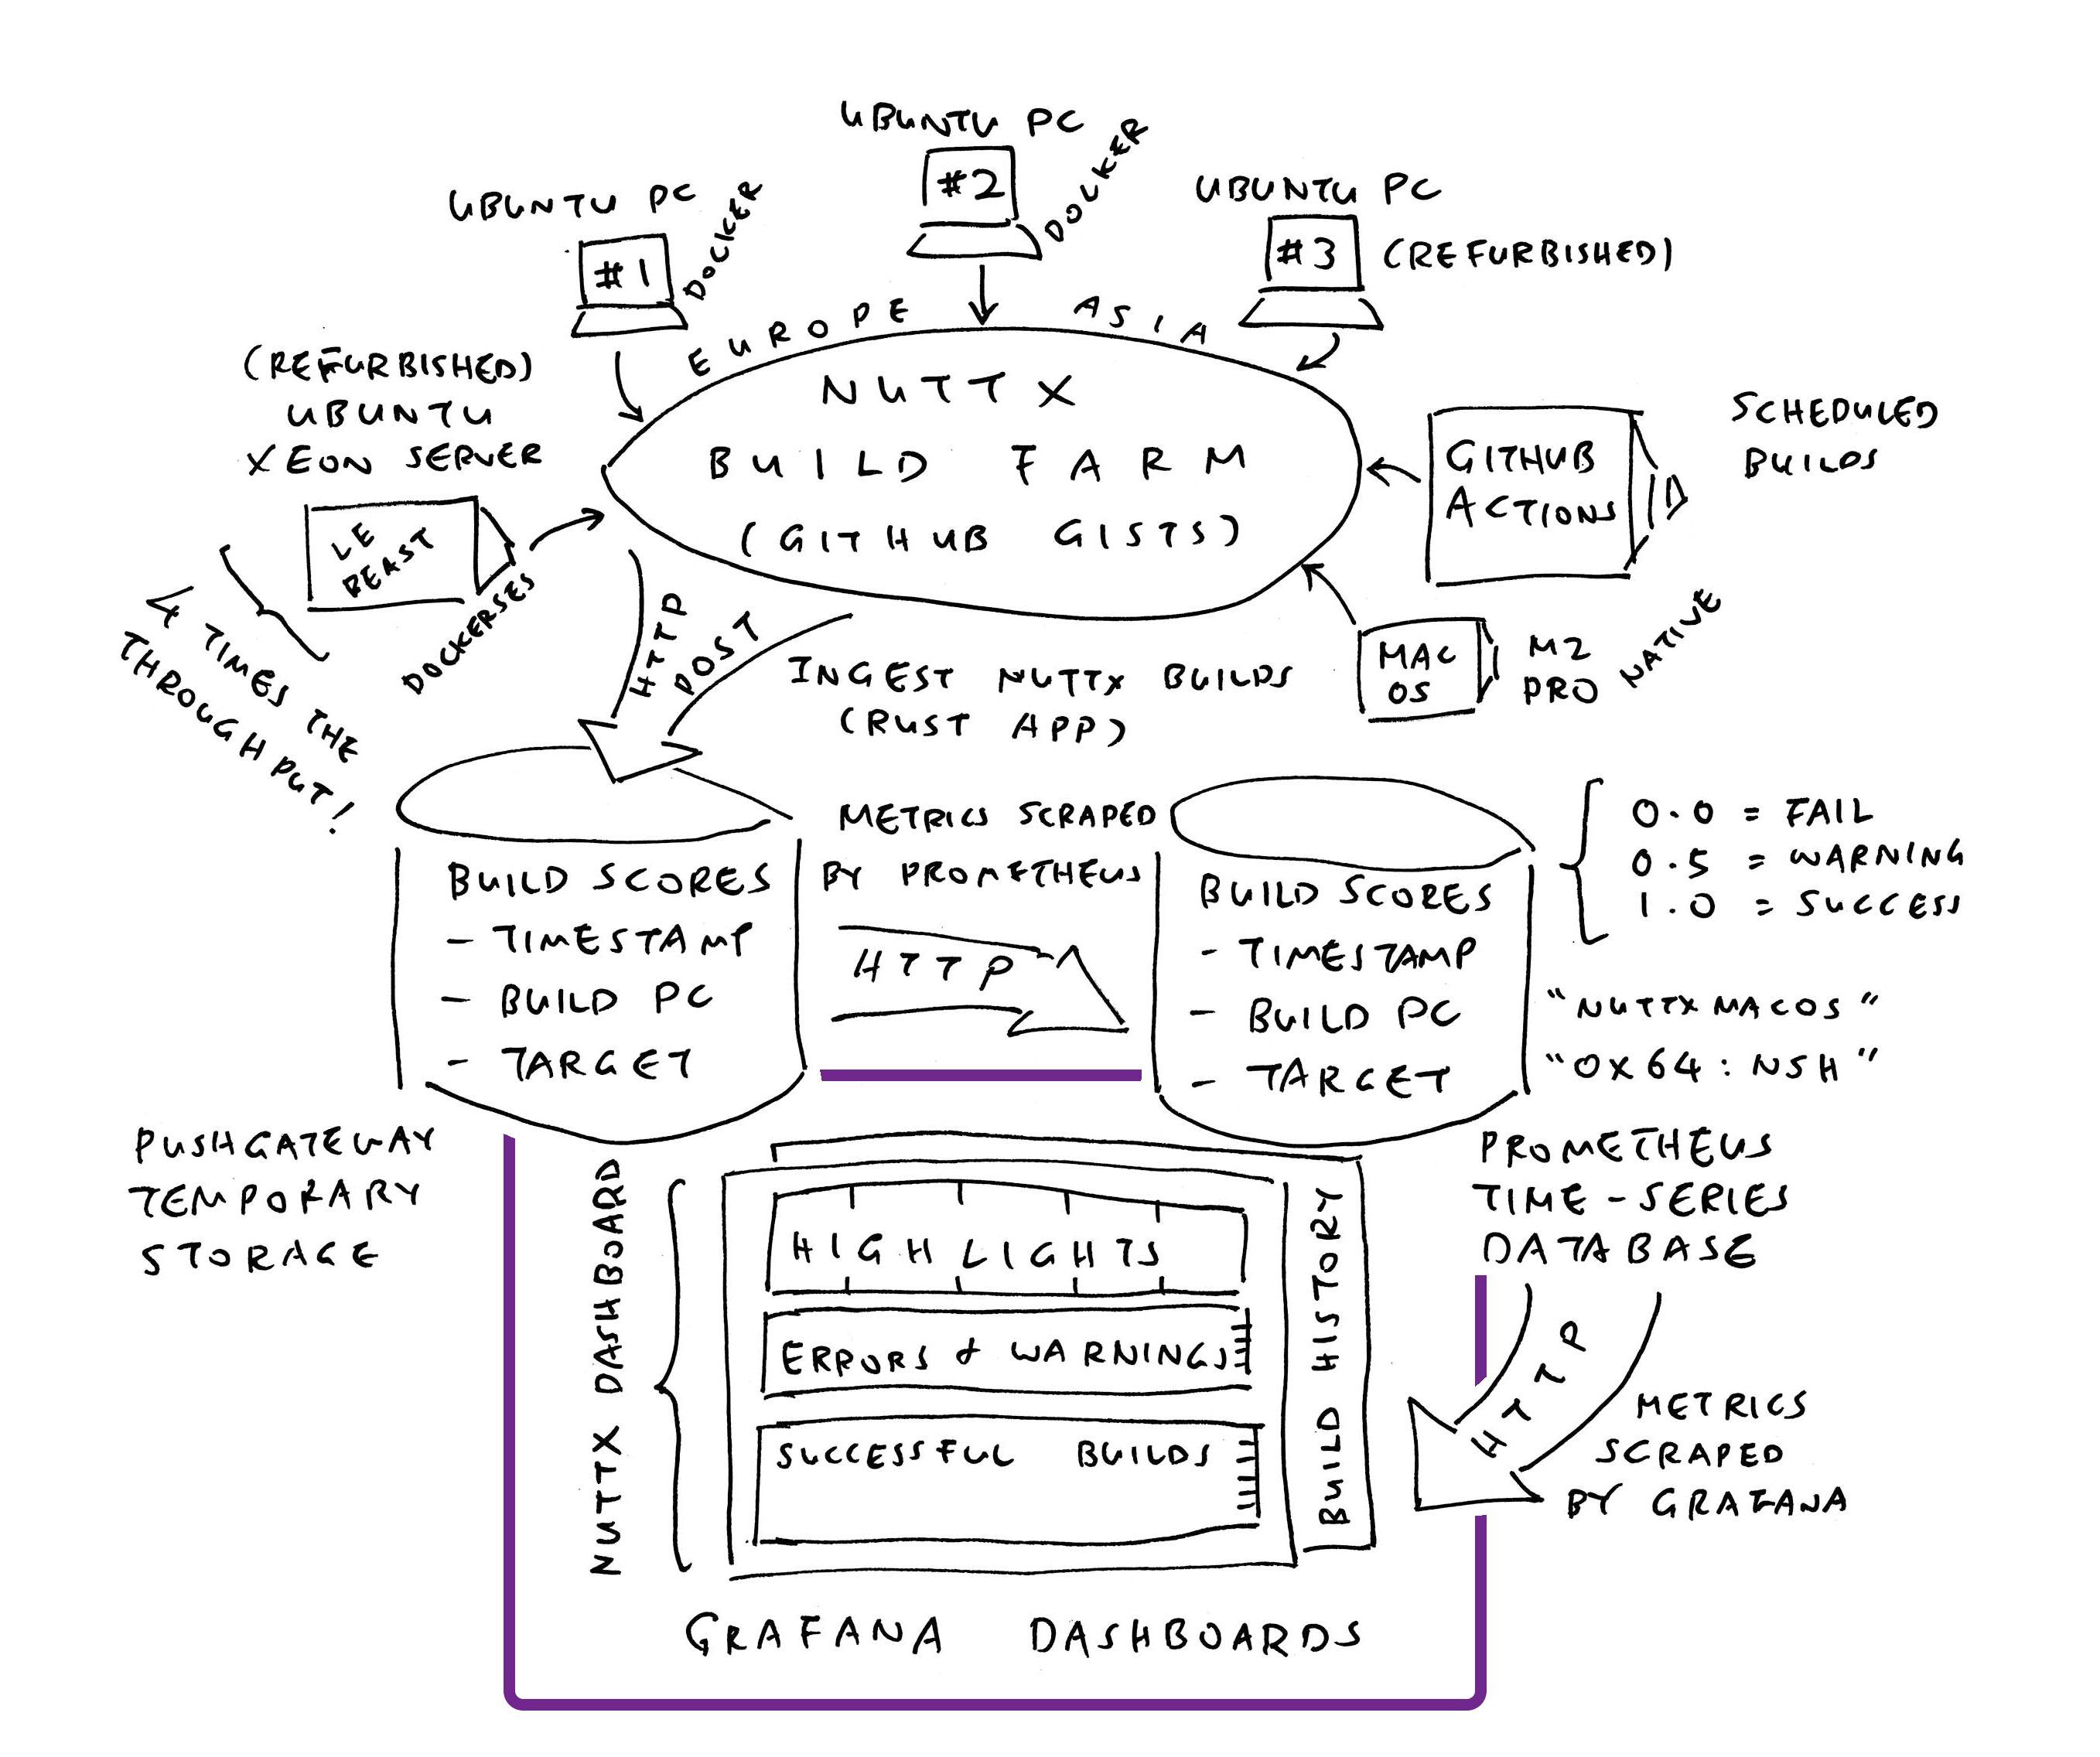
Funny Thing about Prometheus: We can’t push Time-Series Data to Prometheus Server, and expect it to be stored. Instead we do this…
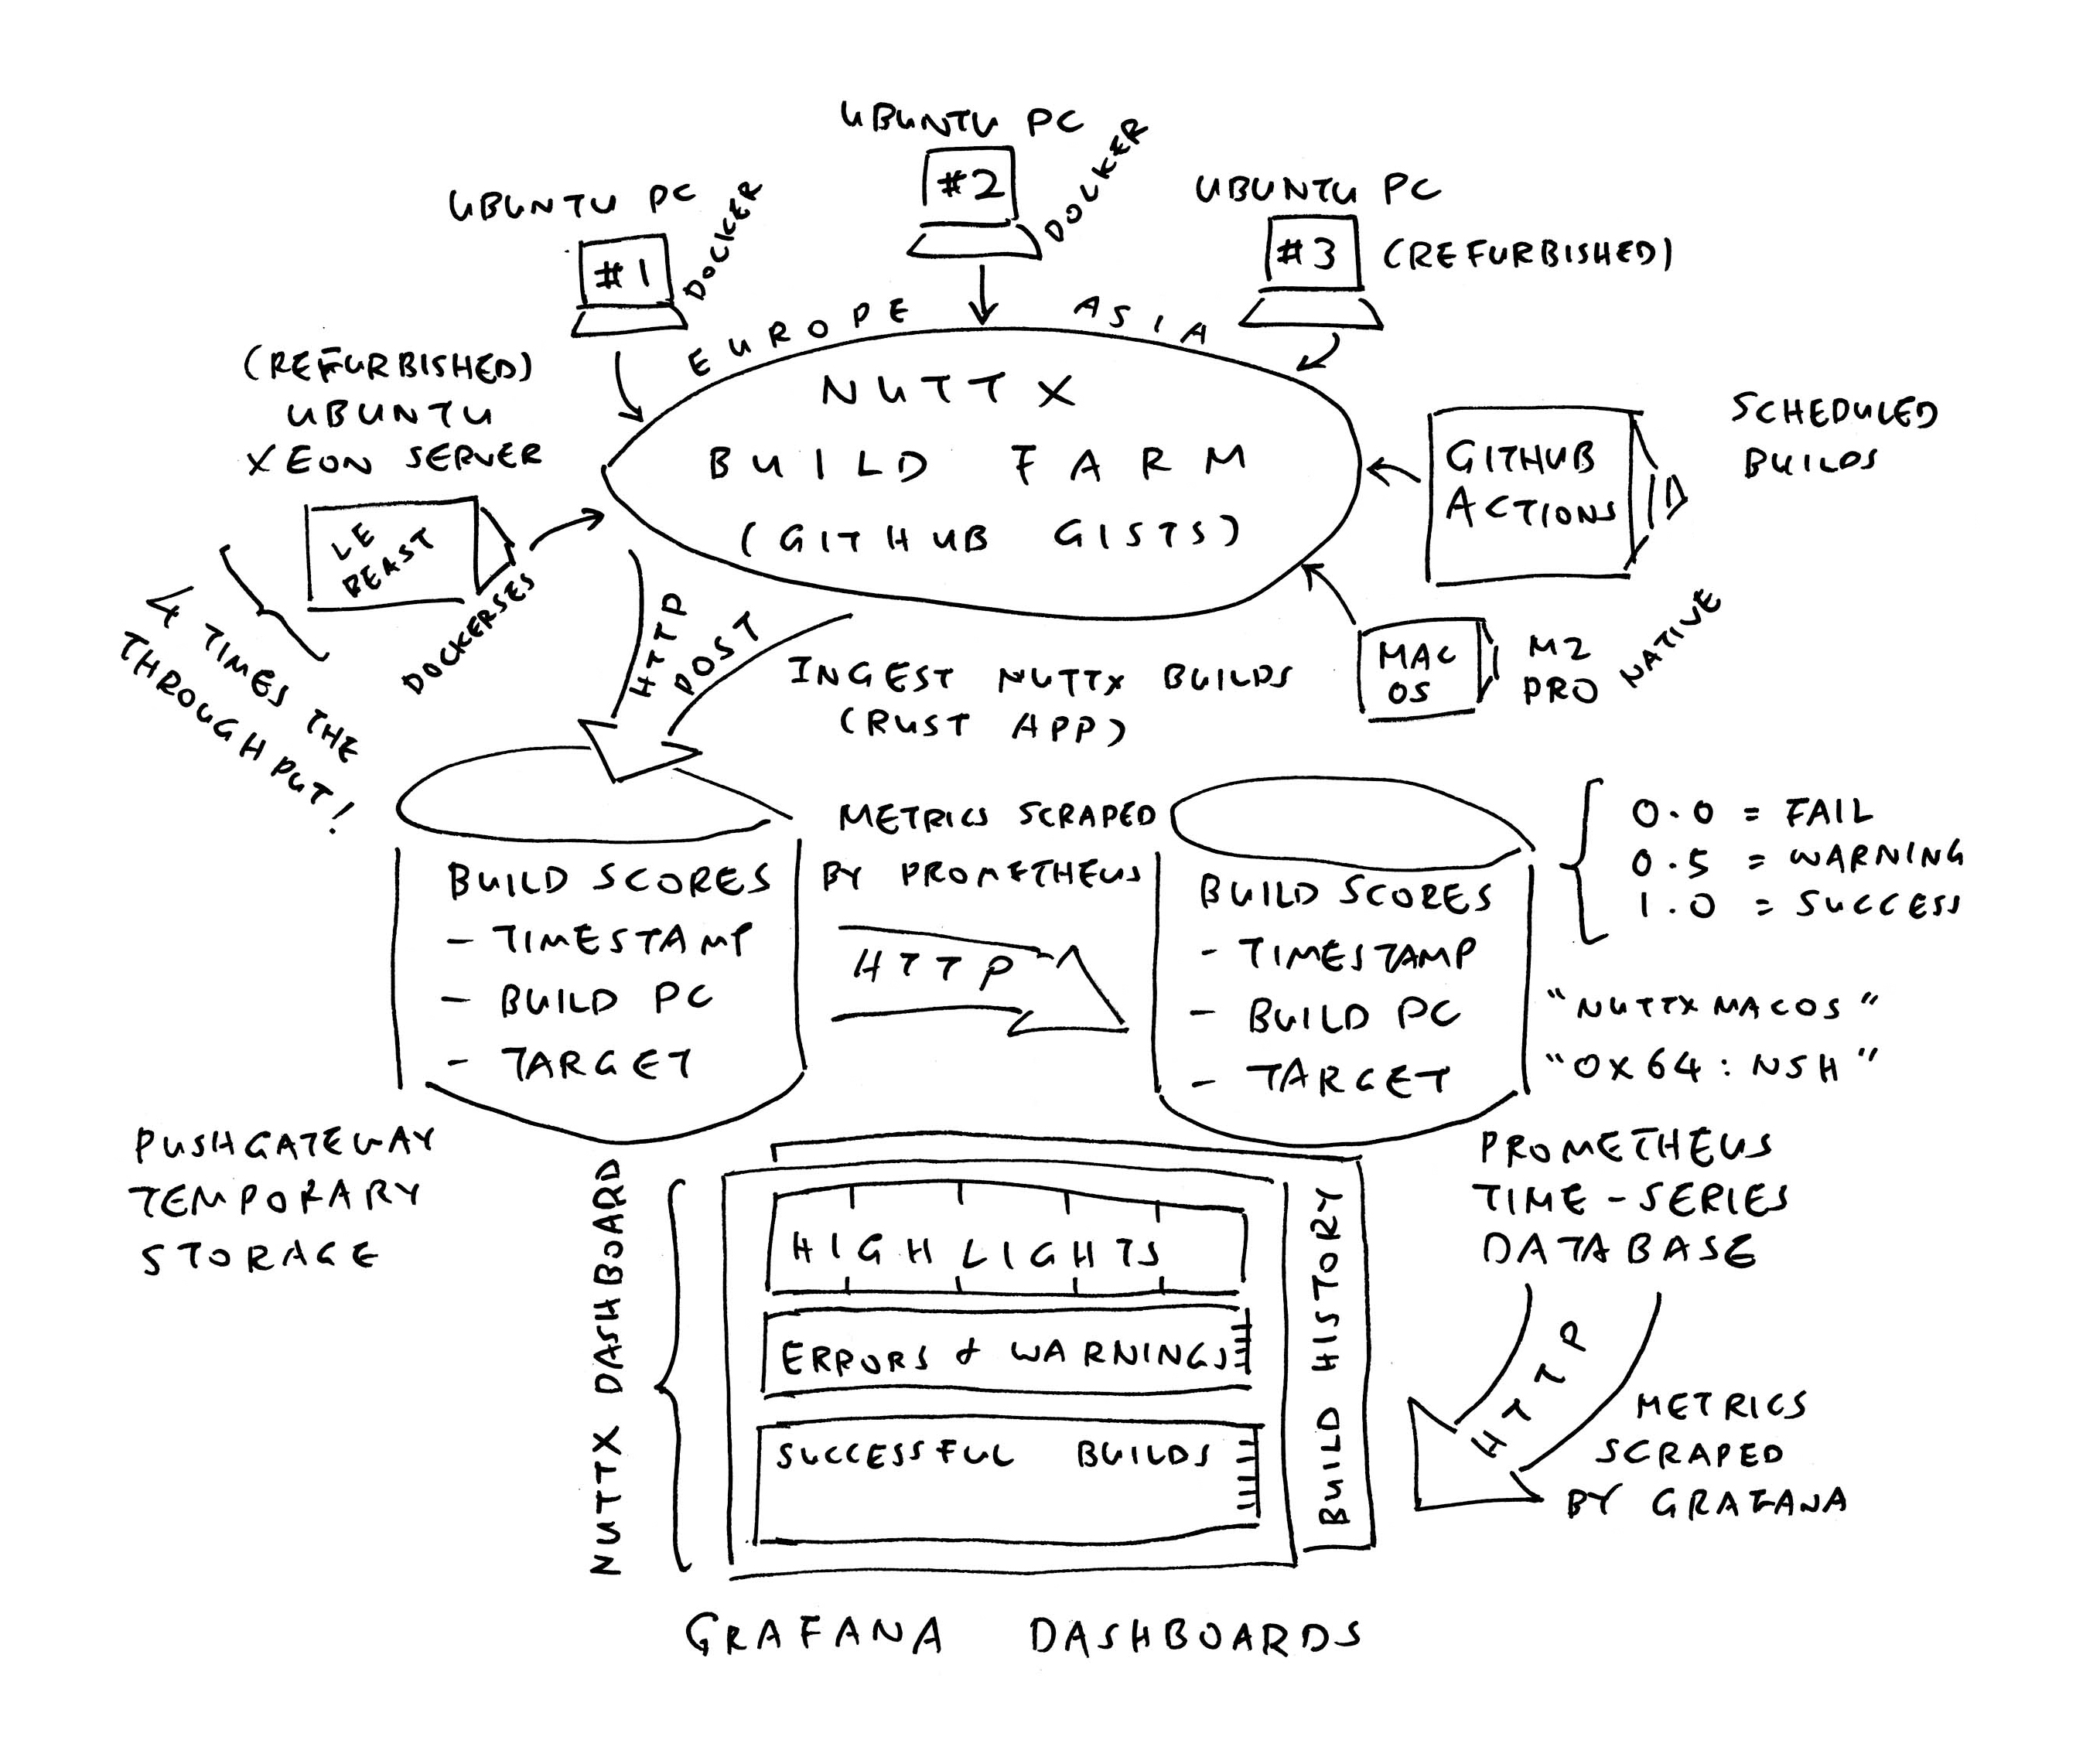
We install Prometheus Pushgateway (as the in-memory Staging Area for Time-Series Data)
We push our Time-Series Data to Prometheus Pushgateway (over HTTP, pic above)
Prometheus Server shall scrape our Time-Series Data from Pushgateway (and store the data)
Here’s how we install Prometheus Pushgateway…
## From https://devopscube.com/setup-prometheus-pushgateway-vm/
wget https://github.com/prometheus/pushgateway/releases/download/v1.11.2/pushgateway-1.11.2.linux-amd64.tar.gz
tar xvf pushgateway-1.11.2.linux-amd64.tar.gz
mv pushgateway-1.11.2.linux-amd64 pushgateway
cd pushgateway/
sudo useradd -rs /bin/false pushgateway
sudo cp pushgateway /usr/local/bin/
sudo chown pushgateway:pushgateway /usr/local/bin/pushgateway
sudo --shell
cat <<EOT > /etc/systemd/system/pushgateway.service
[Unit]
Description=Prometheus Pushgateway
Wants=network-online.target
After=network-online.target
[Service]
User=pushgateway
Group=pushgateway
Type=simple
ExecStart=/usr/local/bin/pushgateway
[Install]
WantedBy=multi-user.target
EOT
exit
sudo systemctl enable pushgateway
sudo systemctl start pushgateway
sudo systemctl status pushgateway
## We should see...
## pushgateway.service - Prometheus Pushgateway
## Loaded: loaded (/etc/systemd/system/pushgateway.service; enabled; preset: enabled)
## Active: active (running) since Mon 2026-01-05 08:46:49 UTC; 4s ago
curl localhost:9091/metrics
## We should see...
## HELP go_gc_duration_seconds A summary of the wall-time pause (stop-the-world) duration in garbage collection cycles.
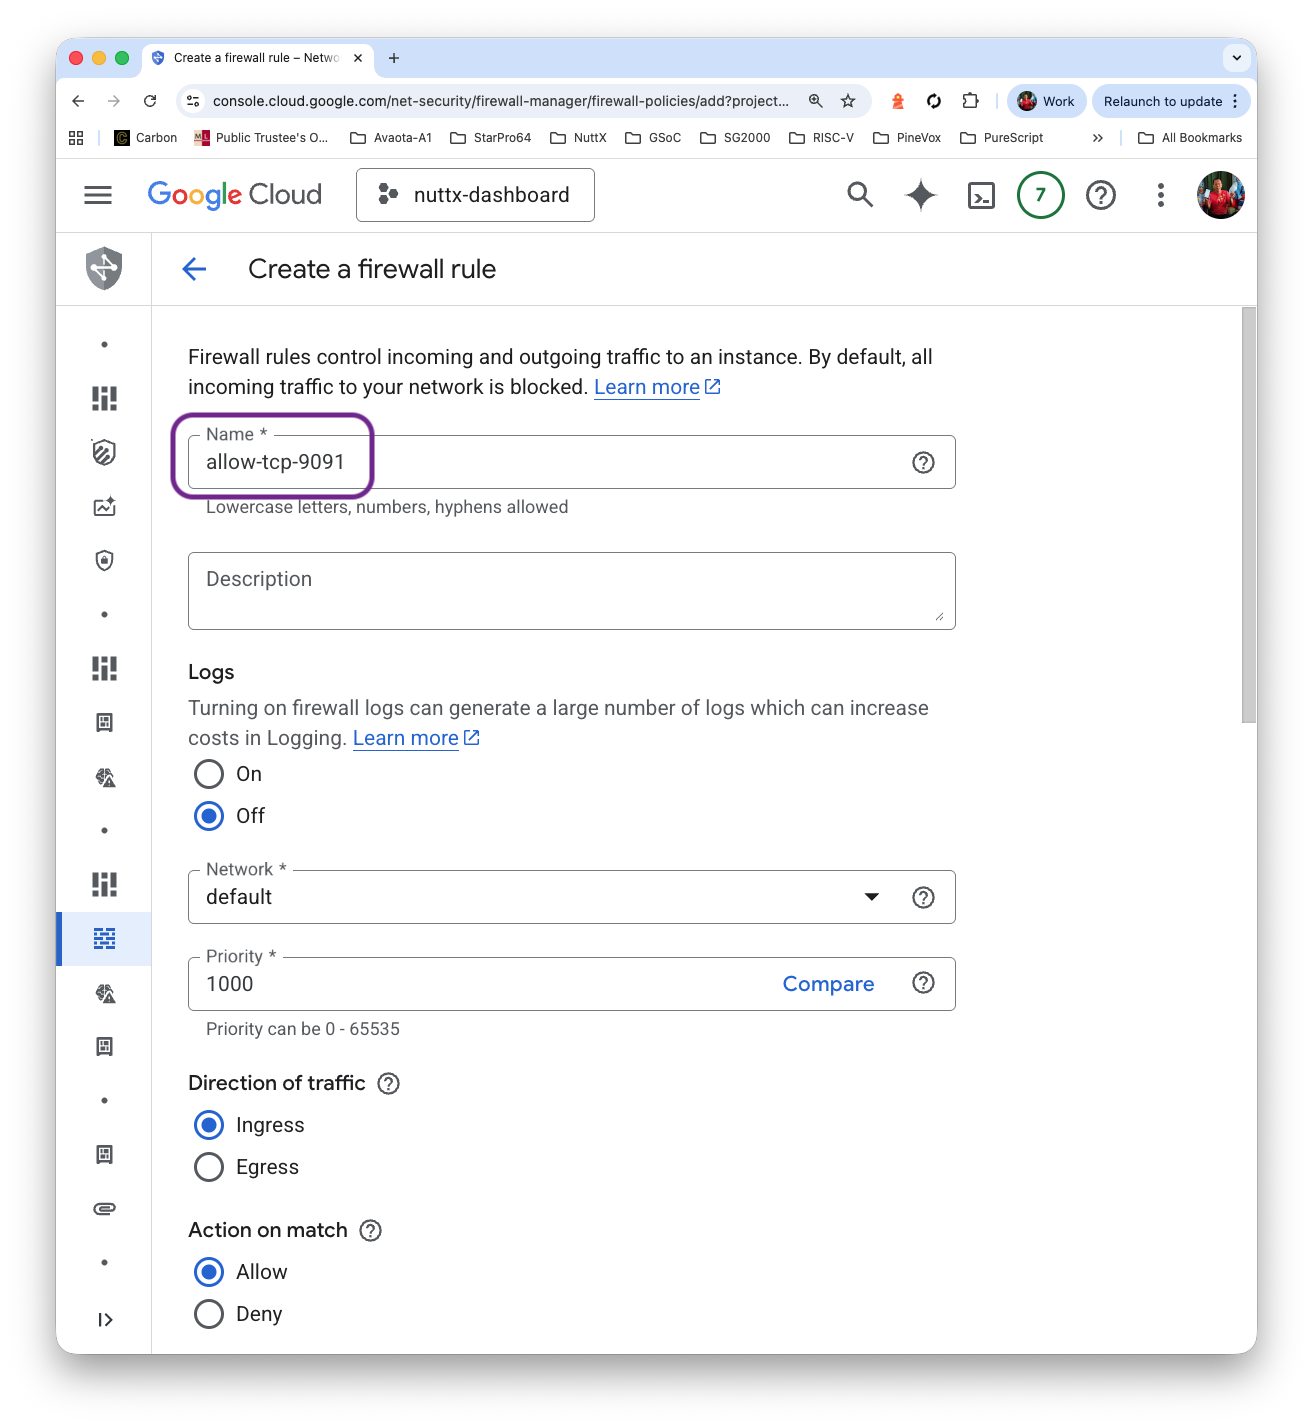
## TYPE go_gc_duration_seconds summaryPrometheus Pushgateway has an Admin UI at TCP Port 9091. We grant access…
Click “VM Instance > Set Up Firewall Rules”
Click “Firewall Policies > Create Firewall Rule”
Name: allow-tcp-9091
Targets: All instances in the network
IPv4 Ranges: 0.0.0.0/0
Protocol and Ports: TCP 9091
Click “Create”

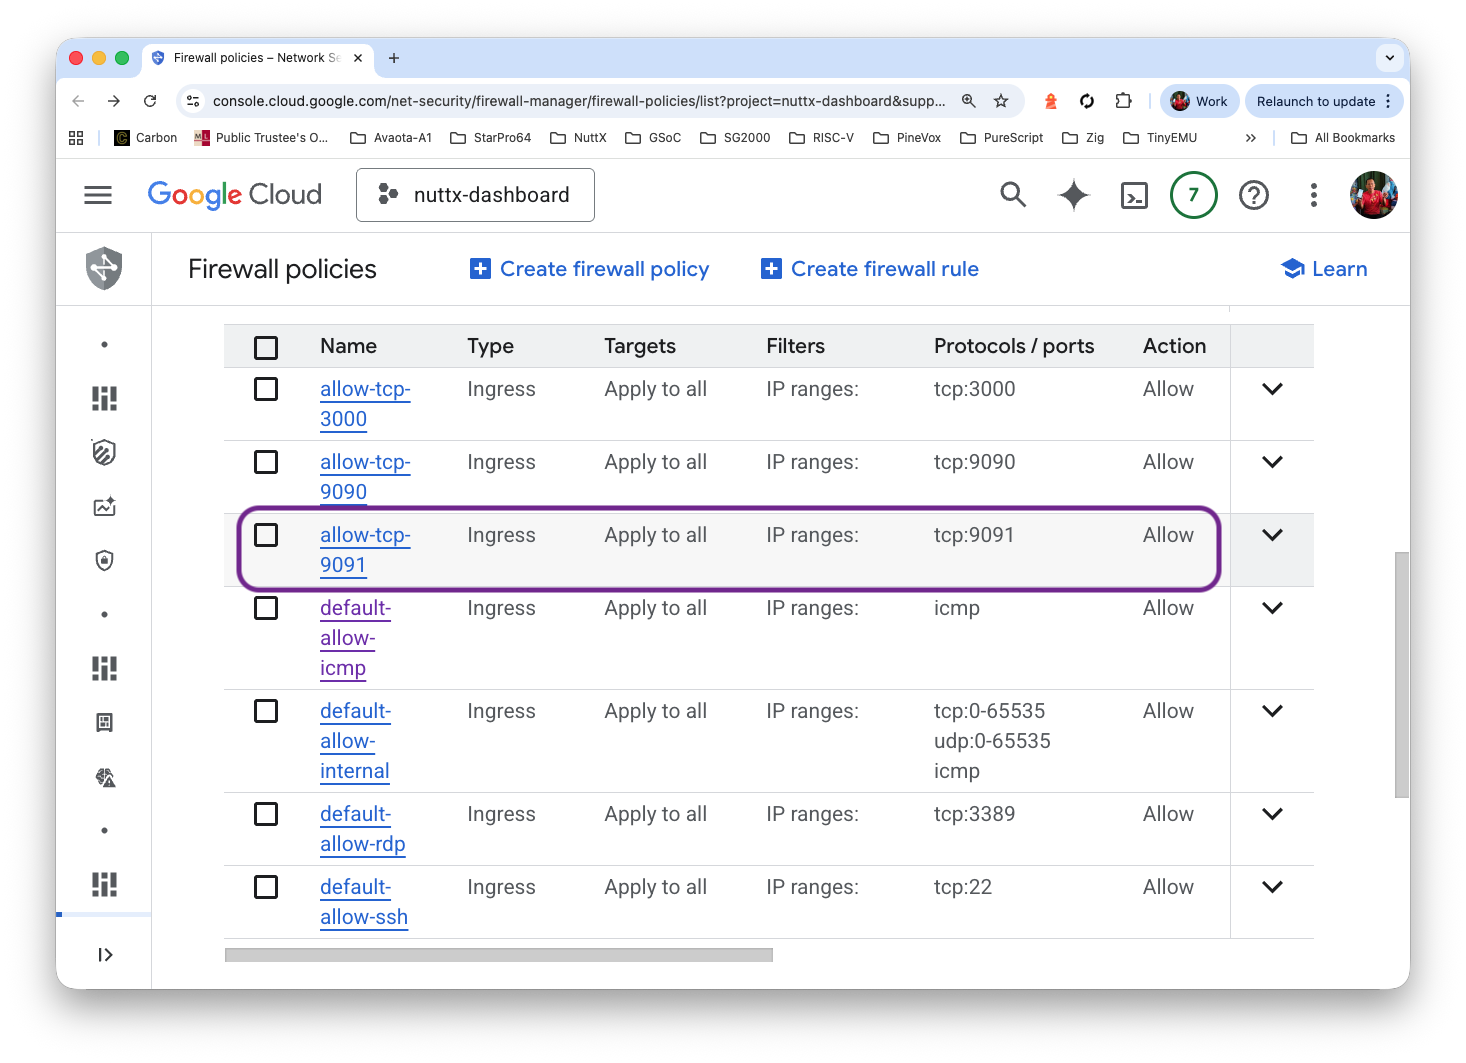
Prometheus Pushgateway appears on our External IP Address at…
http://x.x.x.x:9091
We’re all done with installation! Now we ingest some NuttX Build Logs to verify that Prometheus Server and Pushgateway are talking…
## Download the Sample NuttX Build Log
pushd /tmp
wget https://github.com/lupyuen/ingest-nuttx-builds/releases/download/v1.0.0/defconfig.txt
wget https://github.com/lupyuen/ingest-nuttx-builds/releases/download/v1.0.0/ci-xtensa-02.log
popd

## Install Rust: https://rustup.rs/
## Press Enter for default option
curl --proto '=https' --tlsv1.2 -sSf https://sh.rustup.rs | sh
. "$HOME/.cargo/env"
sudo apt install gcc pkg-config libssl-dev

## Ingest the Sample NuttX Build Log into Prometheus Pushgateway
sudo apt install git
git clone https://github.com/lupyuen/ingest-nuttx-builds
cd ingest-nuttx-builds
cargo run \
  -- \
  --user NuttX \
  --repo nuttx \
  --defconfig /tmp/defconfig.txt \
  --file /tmp/ci-xtensa-02.log \
  --nuttx-hash 59f200ac4fe6c940dc0eab2155bb3cb566724082 \
  --apps-hash 4f93ec0a4335d574eeecfd295584fbfb17056e5b \
  --group xtensa-02 \
  --run-id 20706016275 \
  --job-id 59436813170 \
  --step 10

## We should see...
## lines[0]=Configuration/Tool: esp32s3-devkit/spi
## lines.last=  [1/1] Normalize esp32s3-devkit/spi
## target=esp32s3-devkit:spi
## timestamp=2026-01-05T08:39:57
## body=
## # TYPE build_score gauge
## # HELP build_score 1.0 for successful build, 0.0 for failed build
## build_score{ version="3", timestamp="2026-01-05T08:39:57", timestamp_log="2026-01-05T08:39:57", user="NuttX", arch="xtensa", subarch="esp32s3", group="xtensa-02", board="esp32s3-devkit", config="spi", target="esp32s3-devkit:spi", url="https://github.com/NuttX/nuttx/actions/runs/20706016275/job/59436813170#step:10:2455", url_display="", nuttx_hash="59f200ac4fe6c940dc0eab2155bb3cb566724082", apps_hash="4f93ec0a4335d574eeecfd295584fbfb17056e5b" } 1
## res=Response { url: "http://localhost:9091/metrics/job/NuttX/instance/esp32s3-devkit:spi", status: 200, headers: {"date": "Mon, 05 Jan 2026 10:10:52 GMT", "content-length": "0"} }
Browse to Prometheus Pushgateway at our External IP Address, port 9091. We’ll see the NuttX Build Logs that we have ingested…
http://x.x.x.x:9091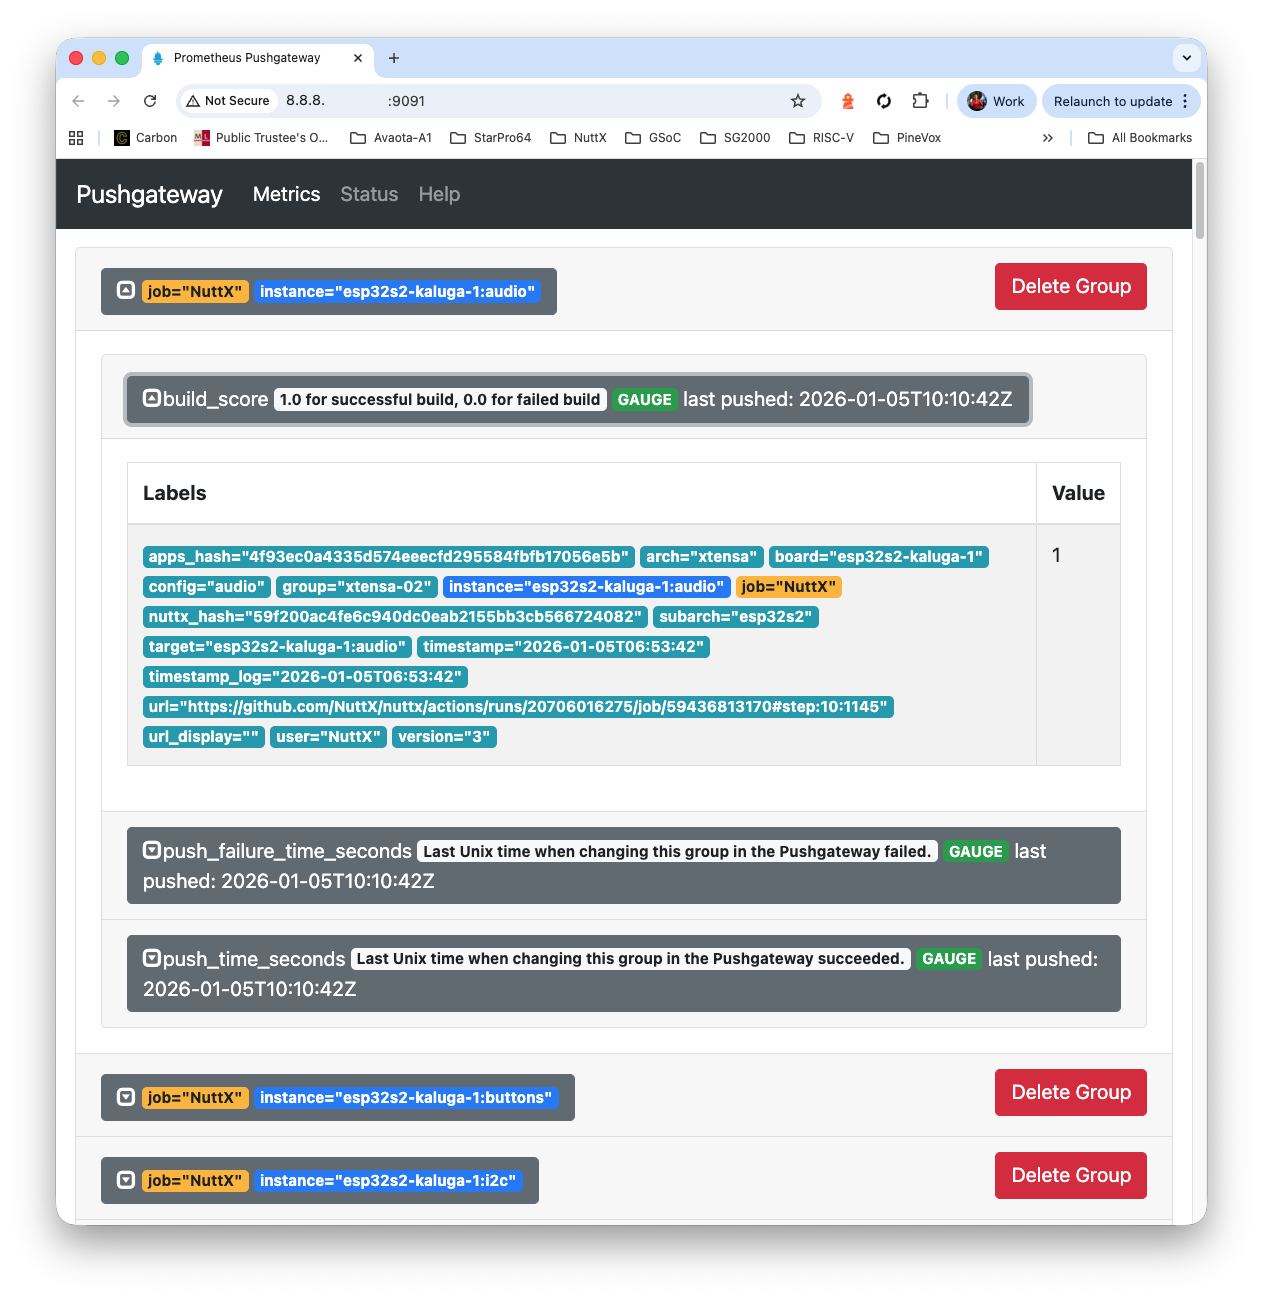
We configure Prometheus Server to talk to Pushgateway…
## Edit the Prometheus Server Config
sudo nano /etc/prometheus/prometheus.yml

## Erase everything in the file. Replace by contents of
## https://github.com/lupyuen/ingest-nuttx-builds/blob/main/prometheus.yml

## Restart our Prometheus Server
sudo systemctl restart prometheus

## Which will scrape the Metrics from Prometheus Pushgateway every 15 seconds...
## global:
##   scrape_interval: 15s
## scrape_configs:
##   - job_name: "prometheus"
##     static_configs:
##     - targets: ["localhost:9090"]
##   - job_name: "pushgateway"
##     static_configs:
##     - targets: ["localhost:9091"]
Wait One Minute: Prometheus Server shall scrape and store the Ingested Build Logs from Pushgateway.
Browse to Prometheus Server at our External IP Address, port 9090…
http://x.x.x.x:9090Enter this Prometheus Query…
build_scoreAnd click “Execute”. Yep Prometheus Server has successfully scraped and stored the NuttX Build Logs from Pushgateway yay!

How will Grafana Dashboard talk to our Prometheus Database?
Inside Grafana: Click “Menu > Data Sources > Prometheus”.
Set the Prometheus Server URL to…
http://localhost:9090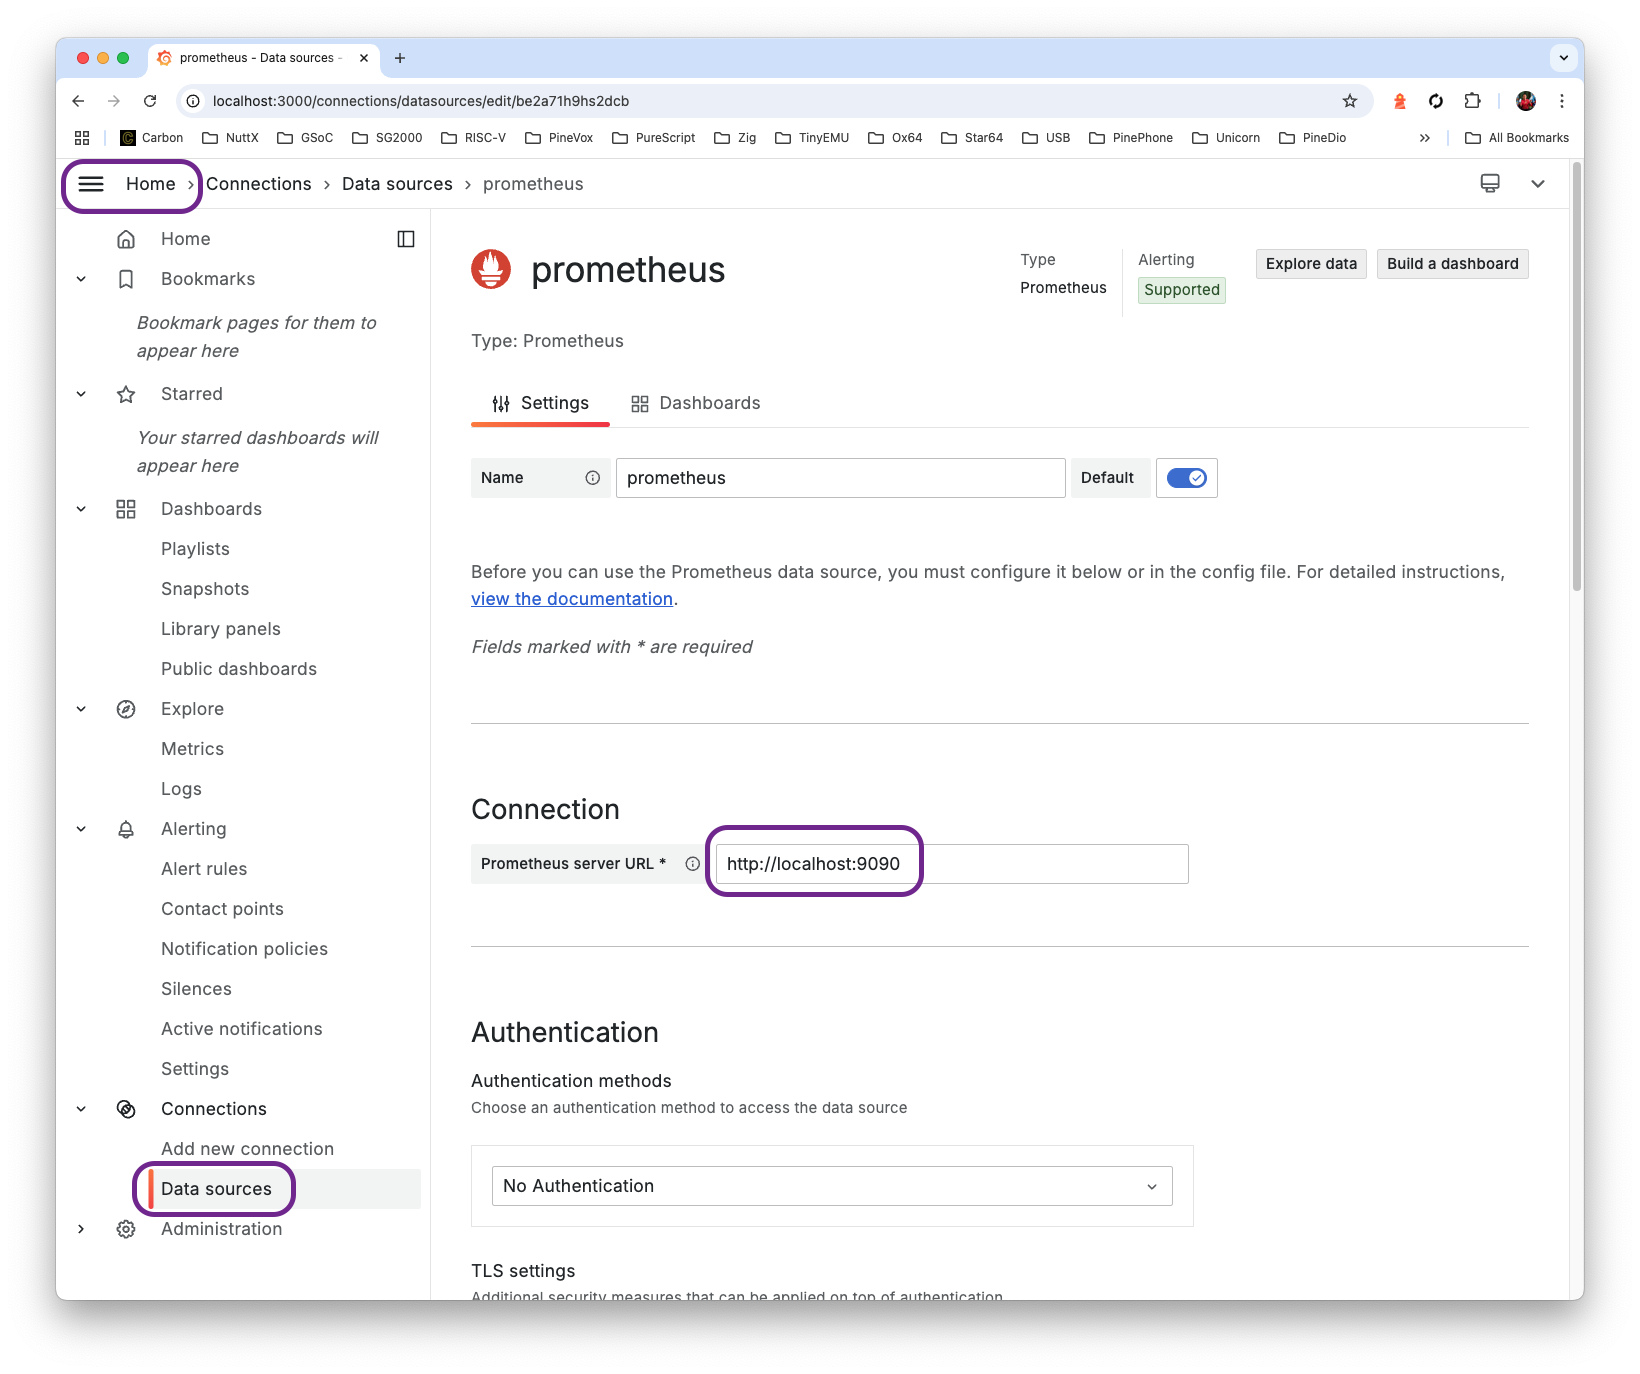
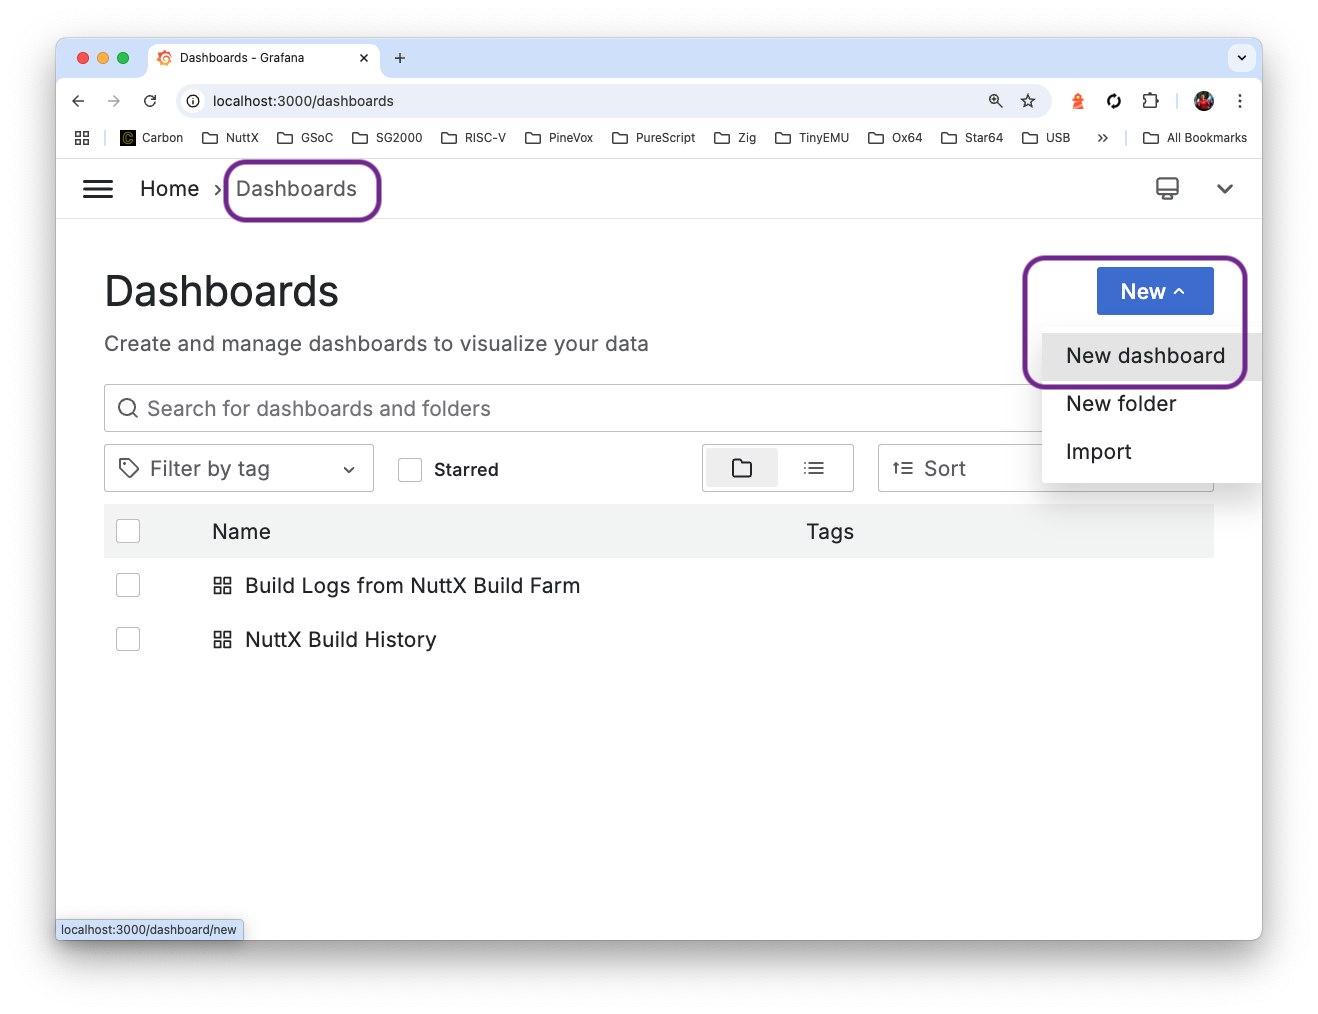
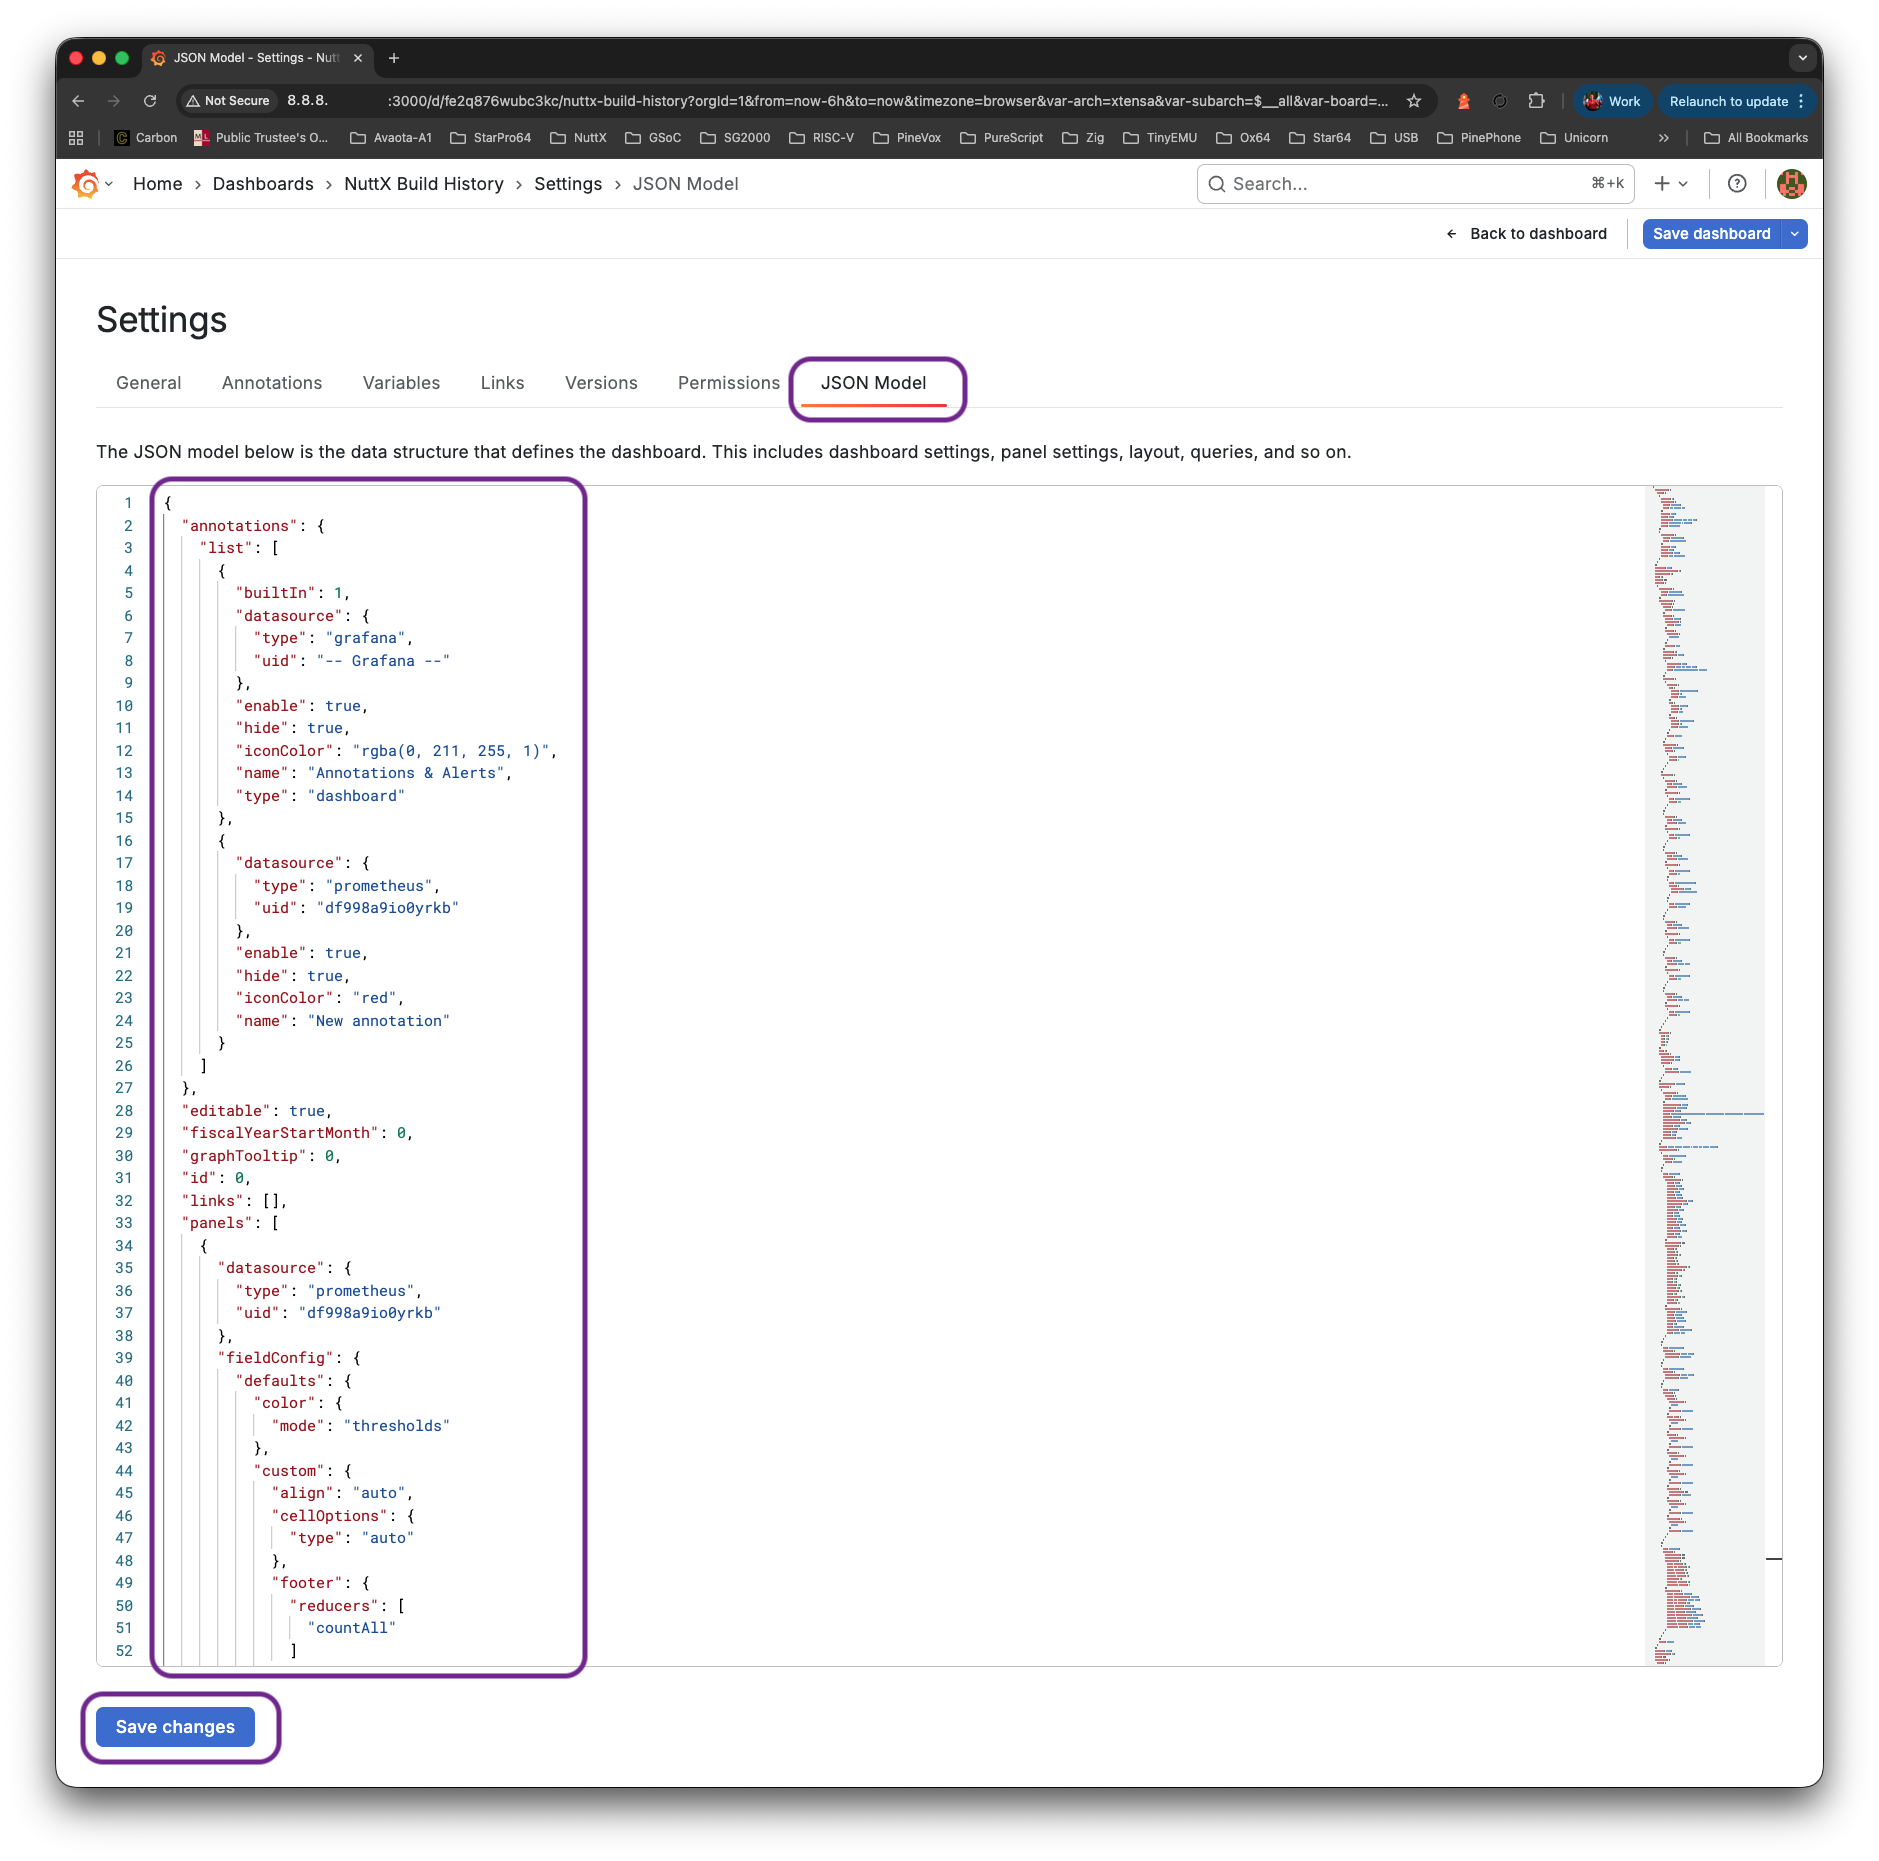
Click “Dashboards > New > New Dashboard”
Click “Settings > JSON Model”
Copy and overwrite the Dashboard JSON from here: dashboard.json
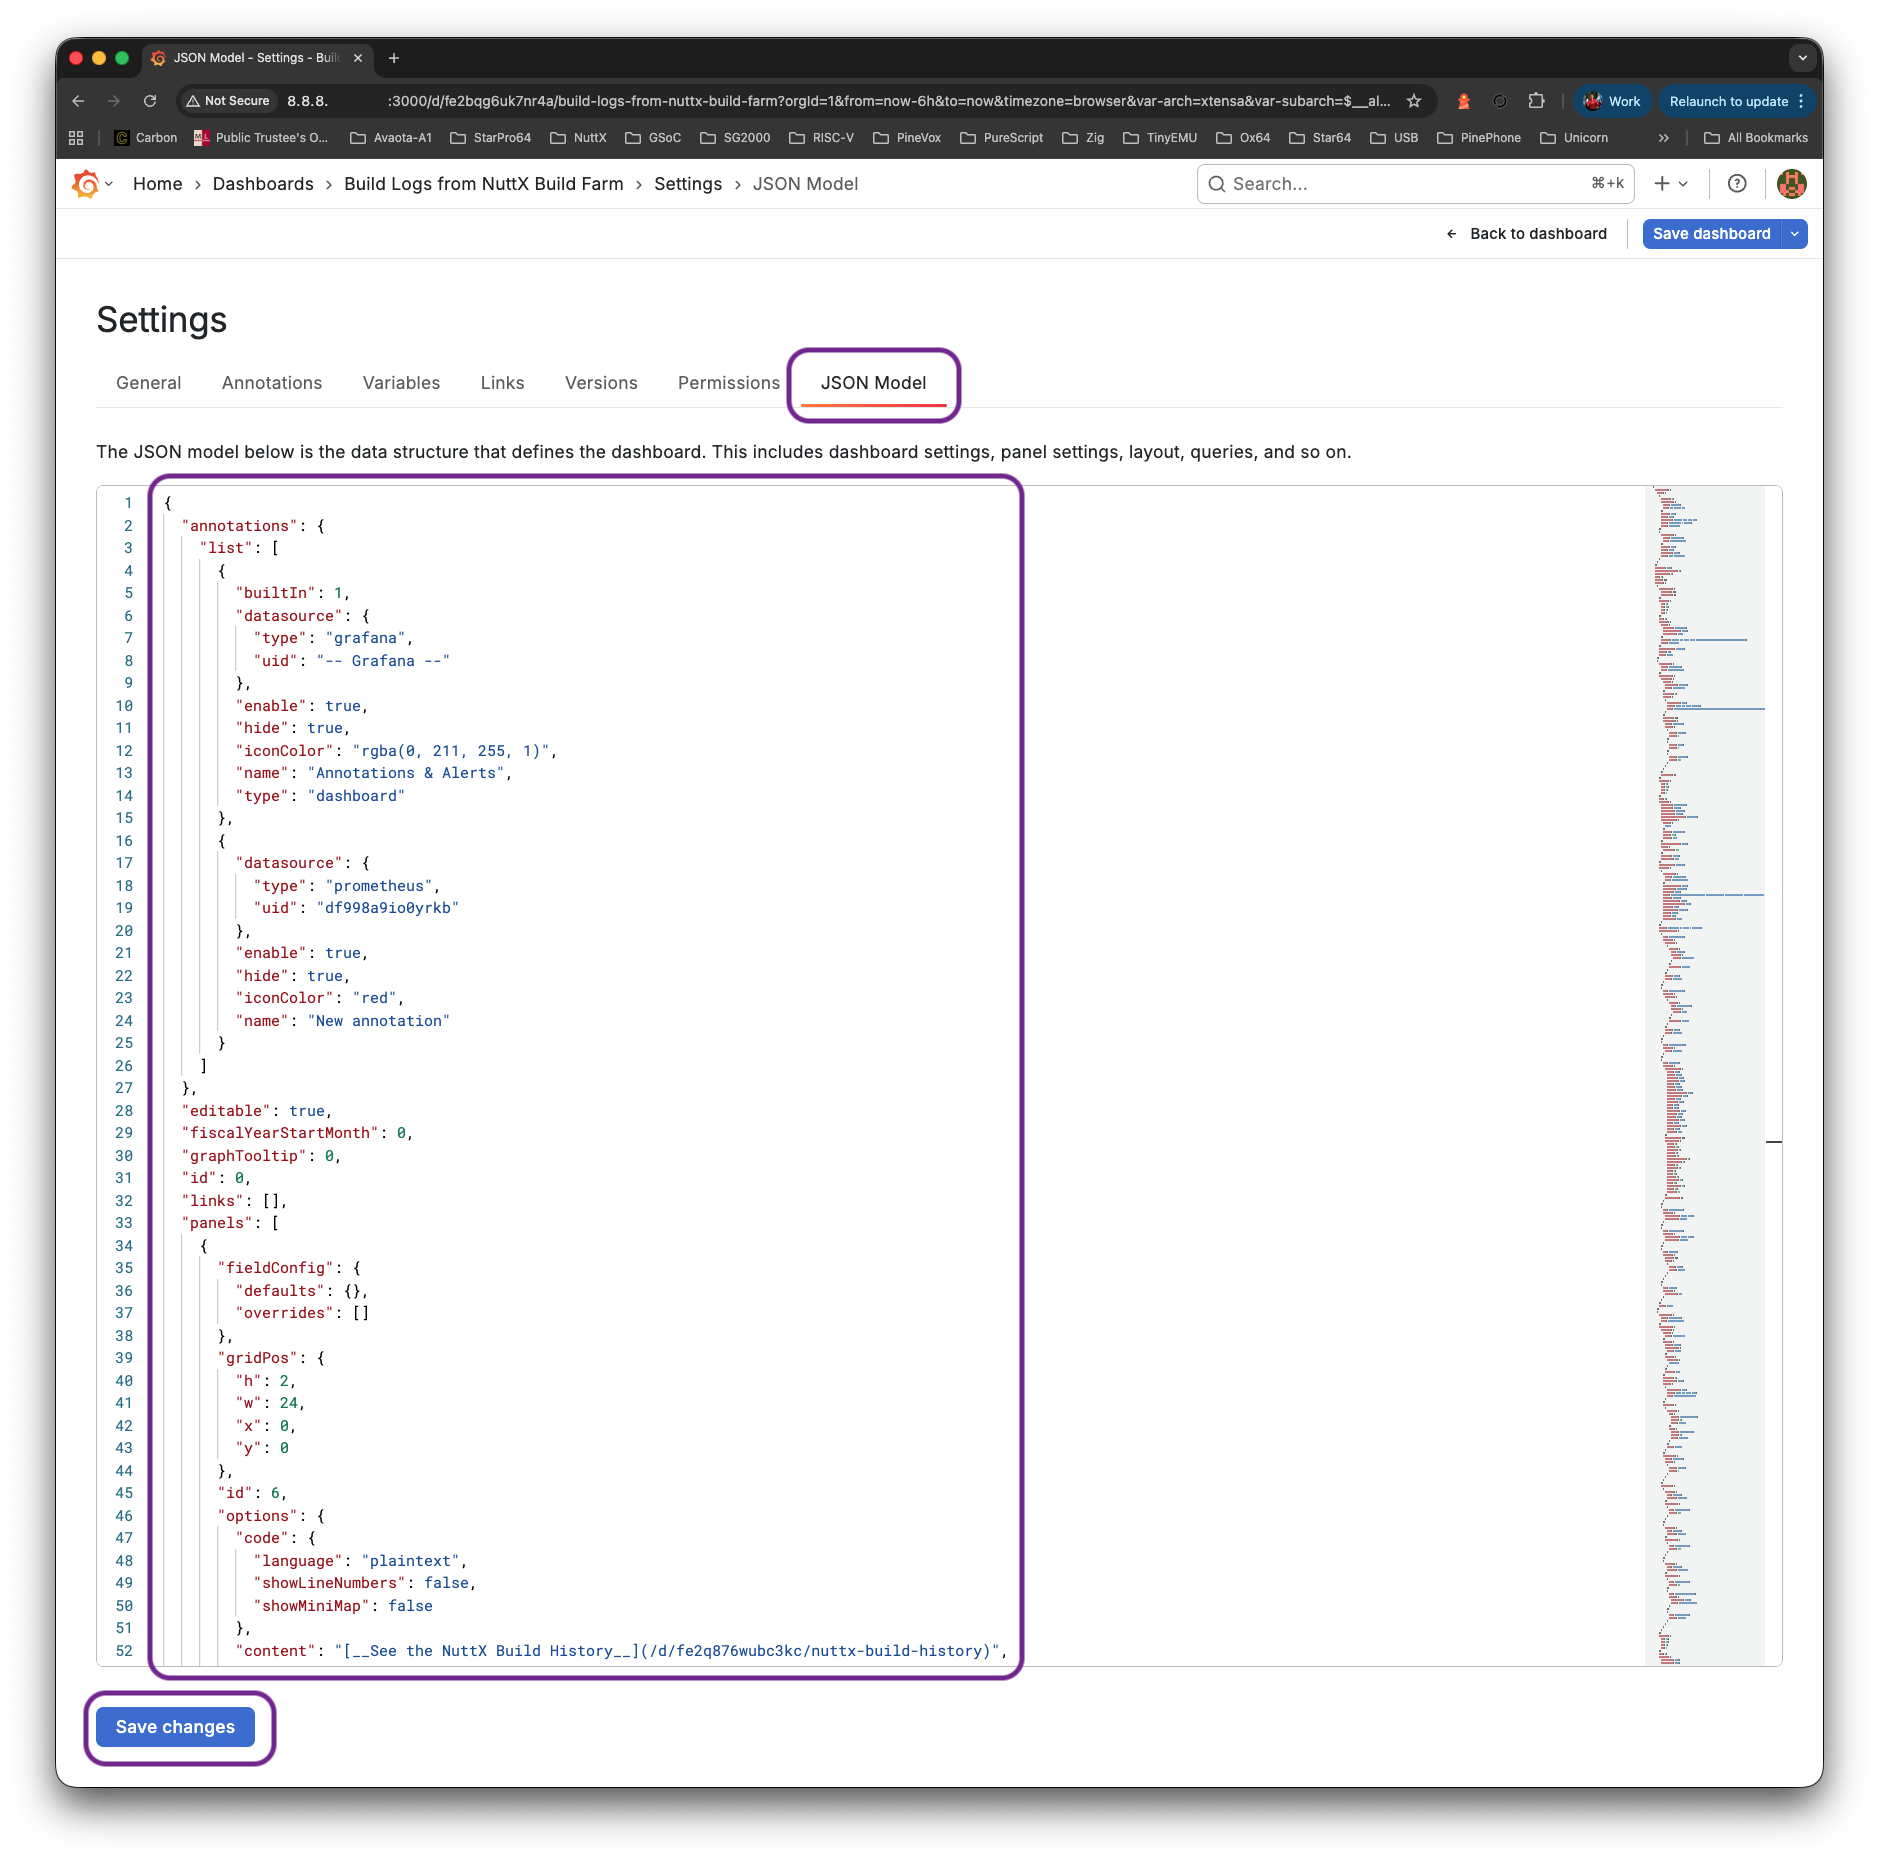
But change ALL references to Prometheus UID…
...
"datasource": {
  "type": "prometheus",
  "uid": "df998a9io0yrkb"
}
...
(Get the UID from the Dashboard JSON before overwriting it)
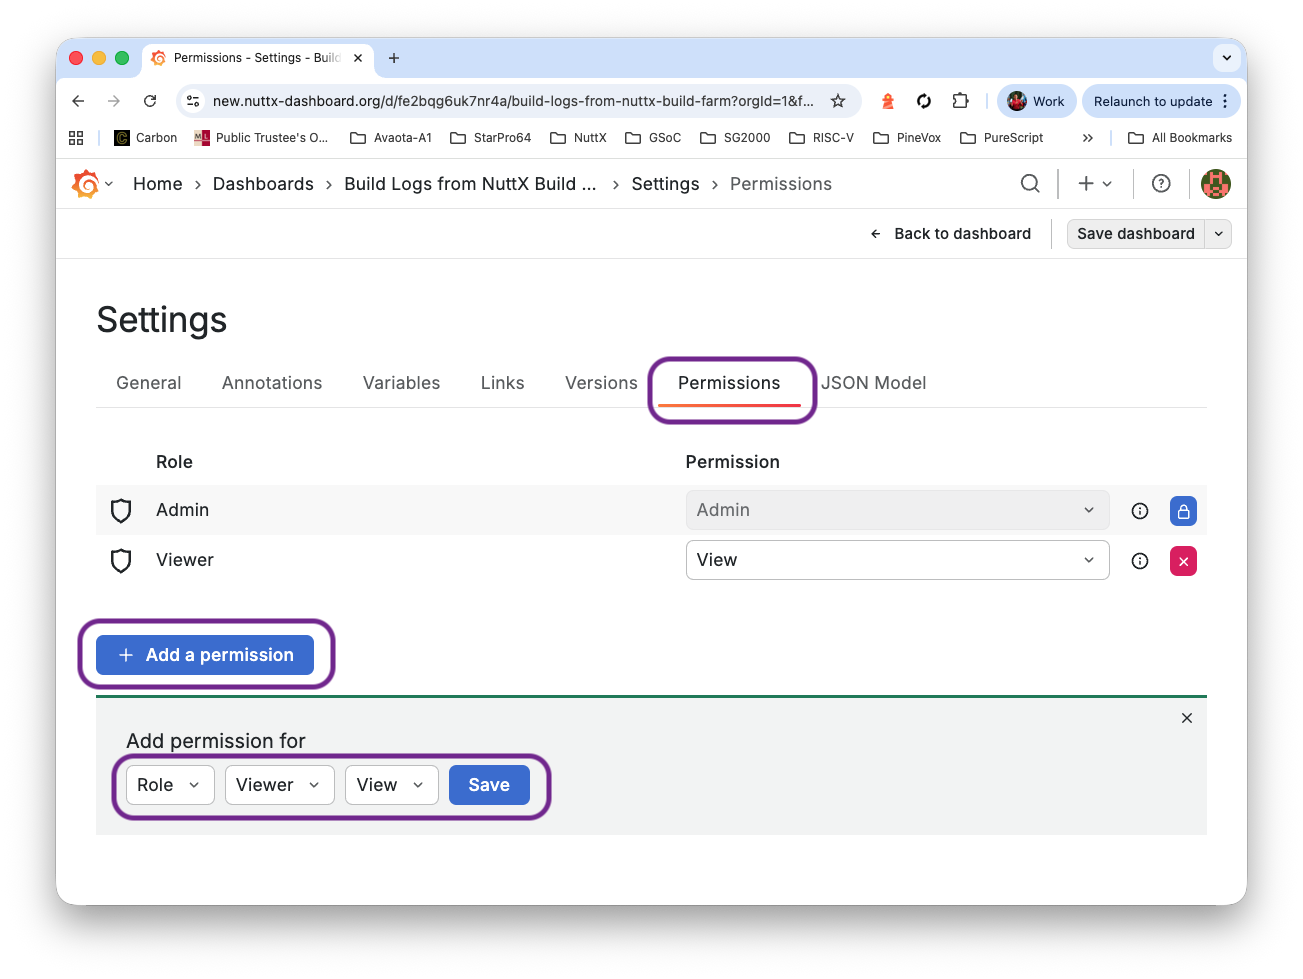
Allow everyone to view: Click “Settings > Add Permission > Role > Viewer > View”
Save the dashboard. That’s our First Dashboard: “Build Logs Dashboard”
Once Again: Click “Dashboards > New > New Dashboard”
Click “Settings > JSON Model”
Copy and overwite the Dashboard History JSON from here: dashboard-history.json
But change ALL references to Prometheus UID…
...
"datasource": {
  "type": "prometheus",
  "uid": "df998a9io0yrkb"
}
...
(Get the UID from the Dashboard JSON before overwriting it)
Allow everyone to view: Click “Settings > Add Permission > Role > Viewer > View”

Save the dashboard. That’s our Second and Final Dashboard: “NuttX Build History Dashboard”
Let’s integrate our dashboard with GitHub Actions…
What’s this GitHub Token?
Our VM shall download and ingest the GitHub Actions Logs. This requires a GitHub Token to access the GitHub Actions Logs.
Inside our VM: Create $HOME/github-token.sh and fill in the GitHub Token. Any Plain GitHub Account will do (like nuttxpr). Don’t use an Admin Account!
## GitHub Settings > Developer Settings > Tokens (Classic) > Generate New Token (Classic)
## Check the following:
## repo (Full control of private repositories)
## repo:status (Access commit status)
## repo_deployment (Access deployment status)
## public_repo (Access public repositories)
## repo:invite (Access repository invitations)
## security_events (Read and write security events)
export GITHUB_TOKEN=...

## Enable Rust Logging
export RUST_LOG=info
export RUST_BACKTRACE=1
If we’re ingesting GitLab Snippets: Create $HOME/gitlab-token.sh and fill in the GitLab Token…
## User Settings > Access tokens
## Select scopes:
## api: Grants complete read/write access to the API, including all groups and projects, the container registry, the dependency proxy, and the package registry.
export GITLAB_TOKEN=...
export GITLAB_USER=lupyuen
export GITLAB_REPO=nuttx-build-log
Make sure that nuttxpr has Push Permission for NuttX Mirror Repo…
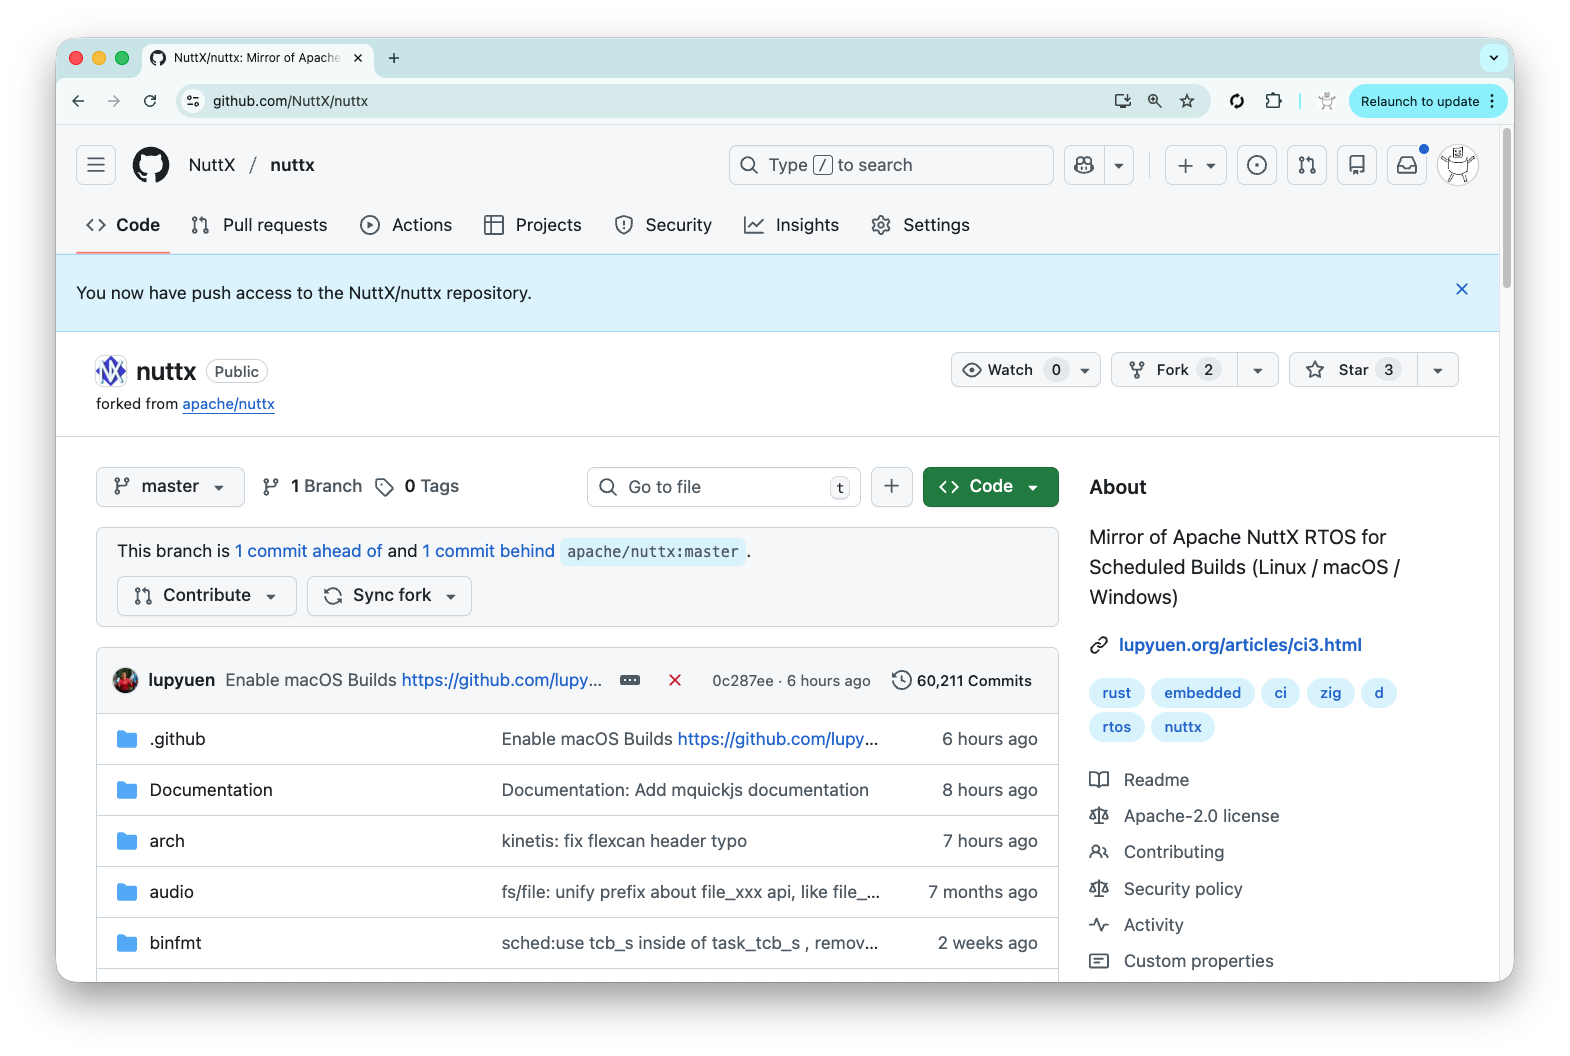
We have a NuttX Mirror Repo (github.com/NuttX/nuttx) that will run Daily Builds of NuttX across all 339 microcontroller boards.
Let’s ingest the GitHub Actions Logs (pic above) from the Mirror Repo Builds. Inside our VM: Do this…
## Install GitHub CLI: https://github.com/cli/cli/blob/trunk/docs/install_linux.md#debian
(type -p wget >/dev/null || (sudo apt update && sudo apt install wget -y)) \
  && sudo mkdir -p -m 755 /etc/apt/keyrings \
  && out=$(mktemp) && wget -nv -O$out https://cli.github.com/packages/githubcli-archive-keyring.gpg \
  && cat $out | sudo tee /etc/apt/keyrings/githubcli-archive-keyring.gpg > /dev/null \
  && sudo chmod go+r /etc/apt/keyrings/githubcli-archive-keyring.gpg \
  && sudo mkdir -p -m 755 /etc/apt/sources.list.d \
  && echo "deb [arch=$(dpkg --print-architecture) signed-by=/etc/apt/keyrings/githubcli-archive-keyring.gpg] https://cli.github.com/packages stable main" | sudo tee /etc/apt/sources.list.d/github-cli.list > /dev/null \
  && sudo apt update \
  && sudo apt install gh -y
. $HOME/github-token.sh
gh auth status

## We should see...
## ✓ Logged in to github.com account nuttxpr (GITHUB_TOKEN)
## - Active account: true
## - Git operations protocol: https
## - Token: ghp_************************************
## - Token scopes: 'read:org', 'repo'

## github.sh needs the NuttX defconfigs here (yeah we should fix the hardcoded "riscv")
mkdir $HOME/riscv
pushd $HOME/riscv
git clone https://github.com/apache/nuttx
popd

## Ingest the GitHub Actions Logs
## https://github.com/lupyuen/ingest-nuttx-builds/blob/main/github.sh
sudo apt install unzip
cd
git clone https://github.com/lupyuen/ingest-nuttx-builds
cd ingest-nuttx-builds
./github.shCheck Prometheus Pushgateway at our External IP Address, port 9091. We should see the logs ingested from GitHub Actions…
http://x.x.x.x:9091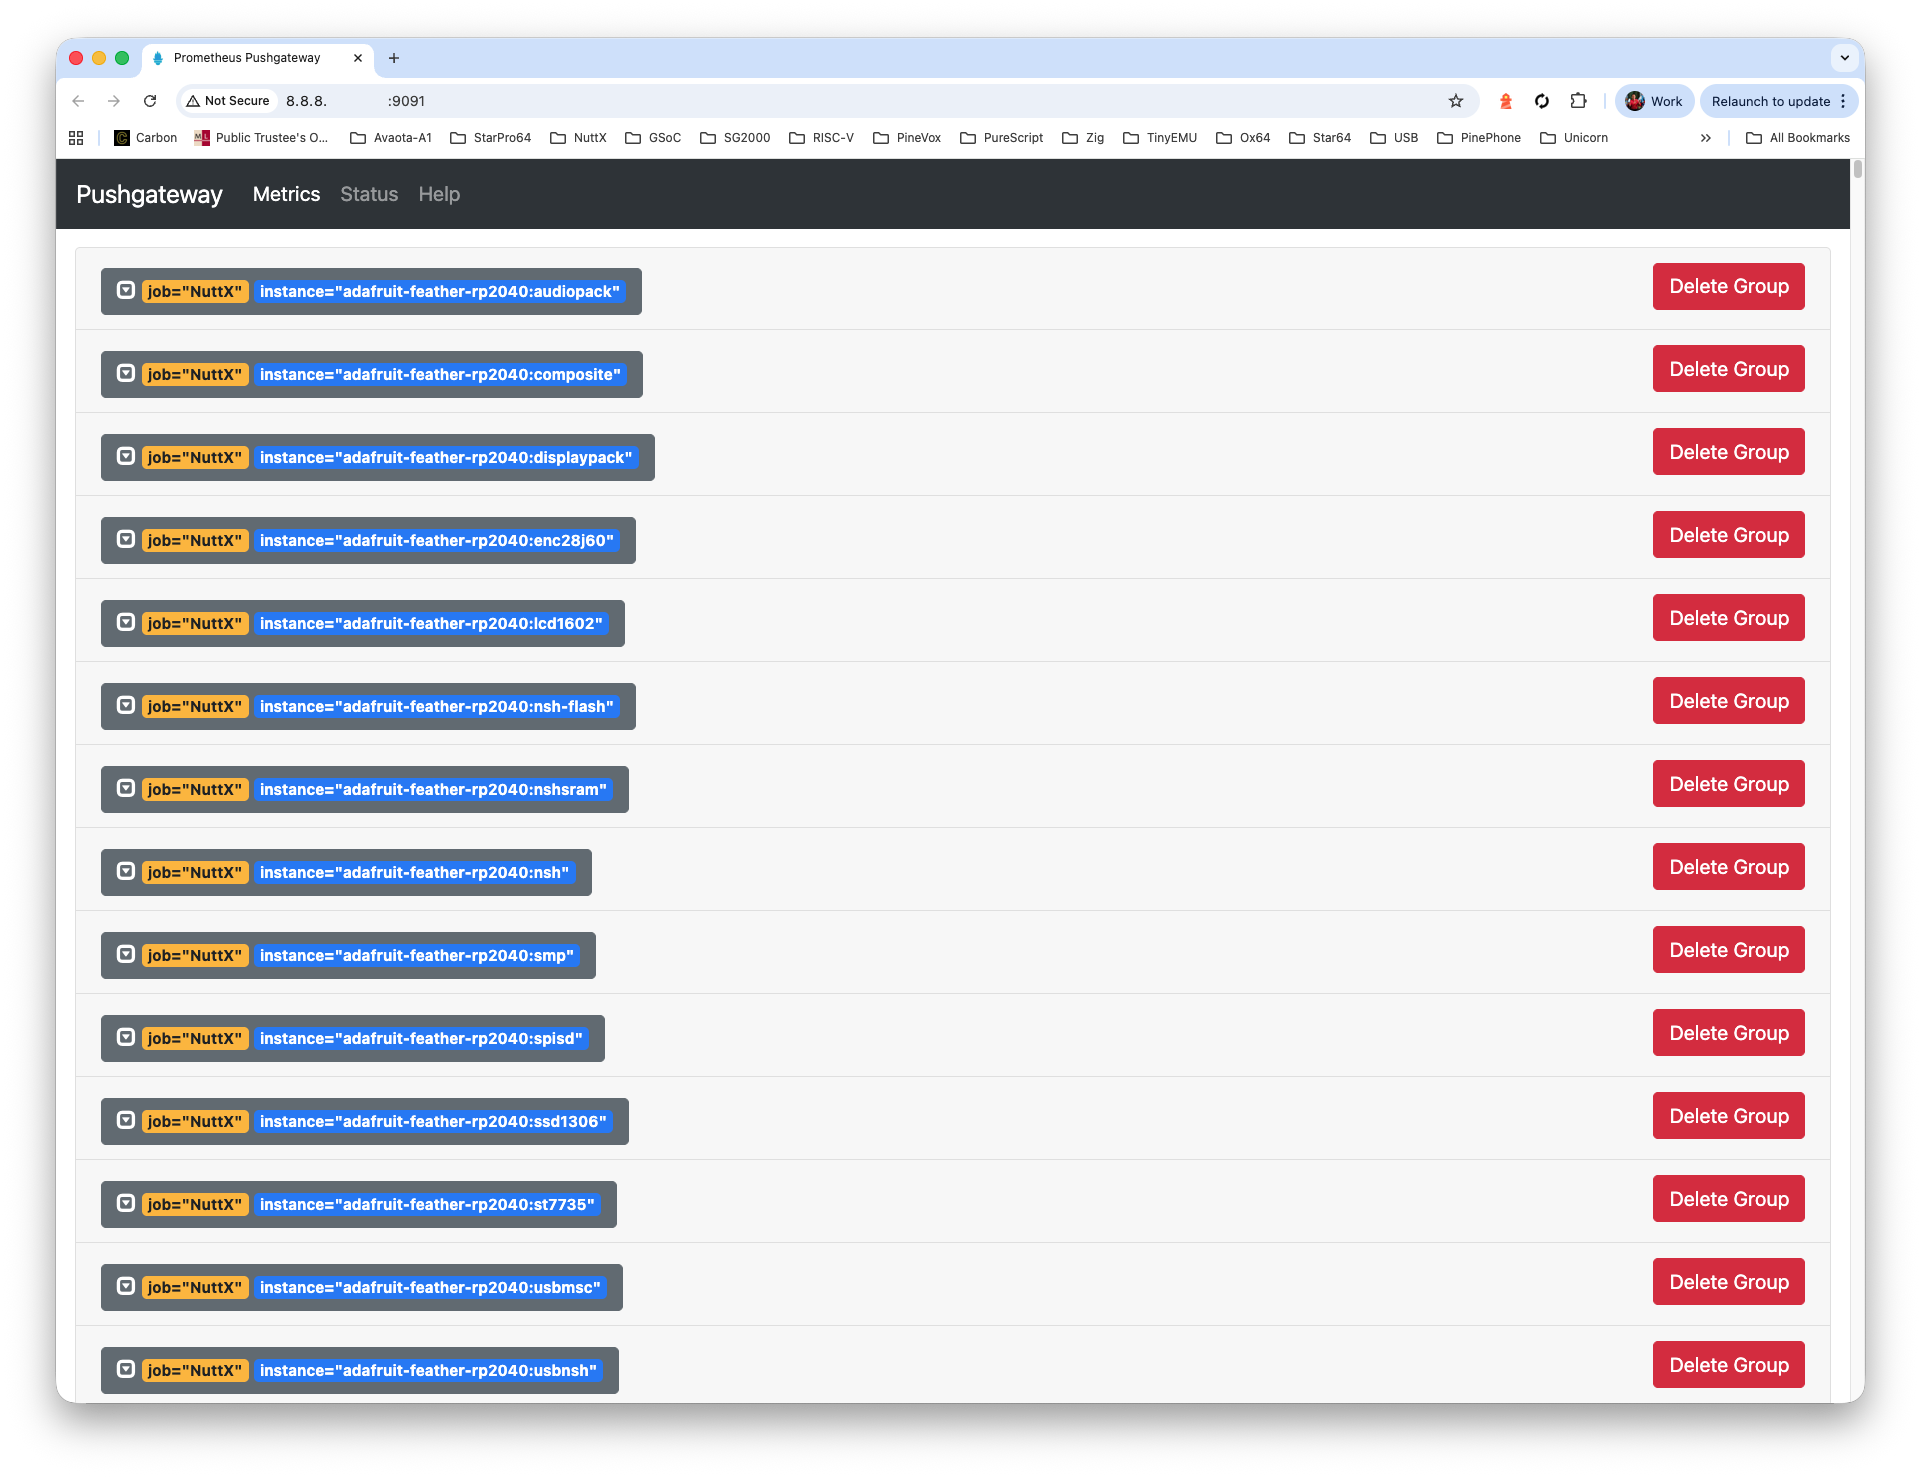
Check Prometheus Server at our External IP Address, port 9090. Enter the Prometheus Query “build_score”, click Execute. We’ll see the same logs…
http://x.x.x.x:9090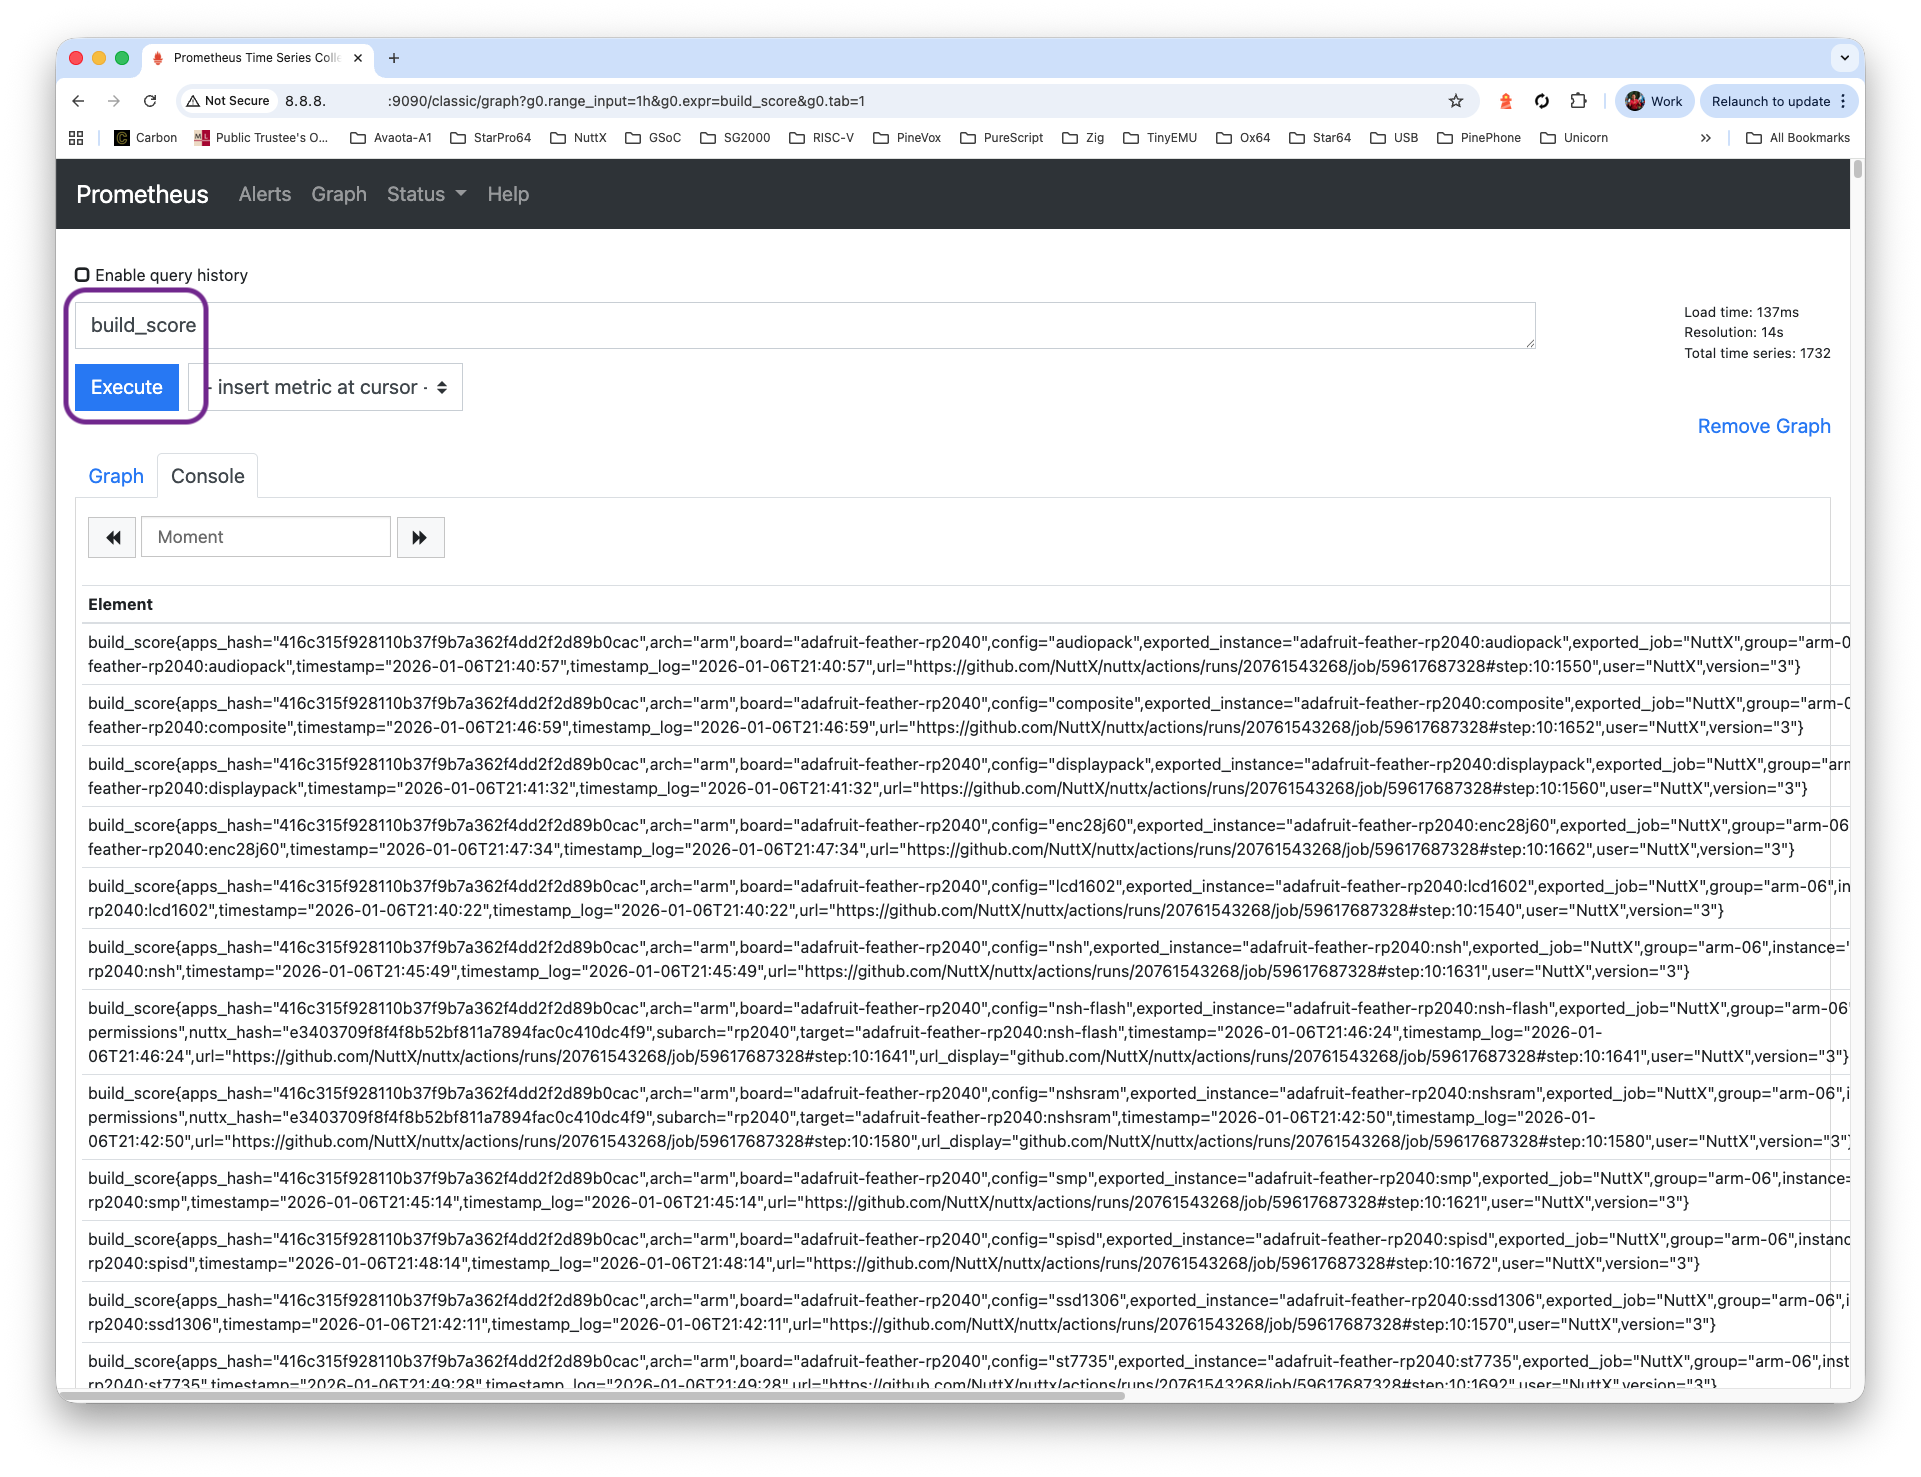
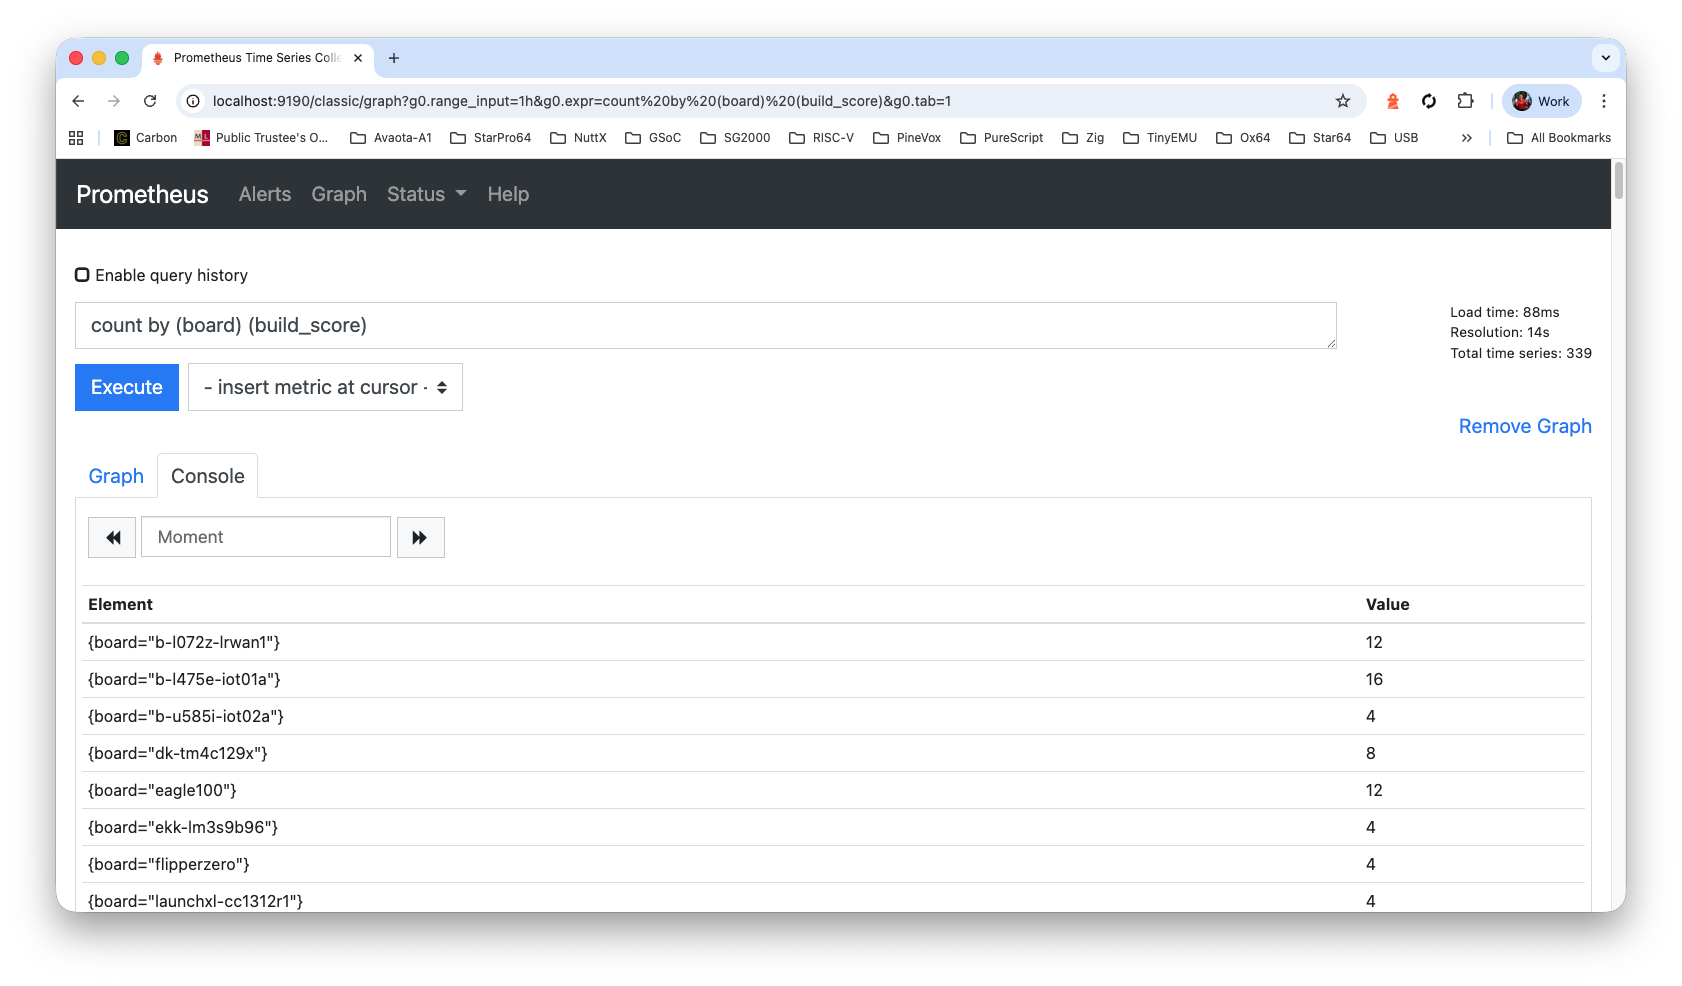
Bonus: This query will reveal that NuttX has 339 microcontroller boards: “count by (board) (build_score)”
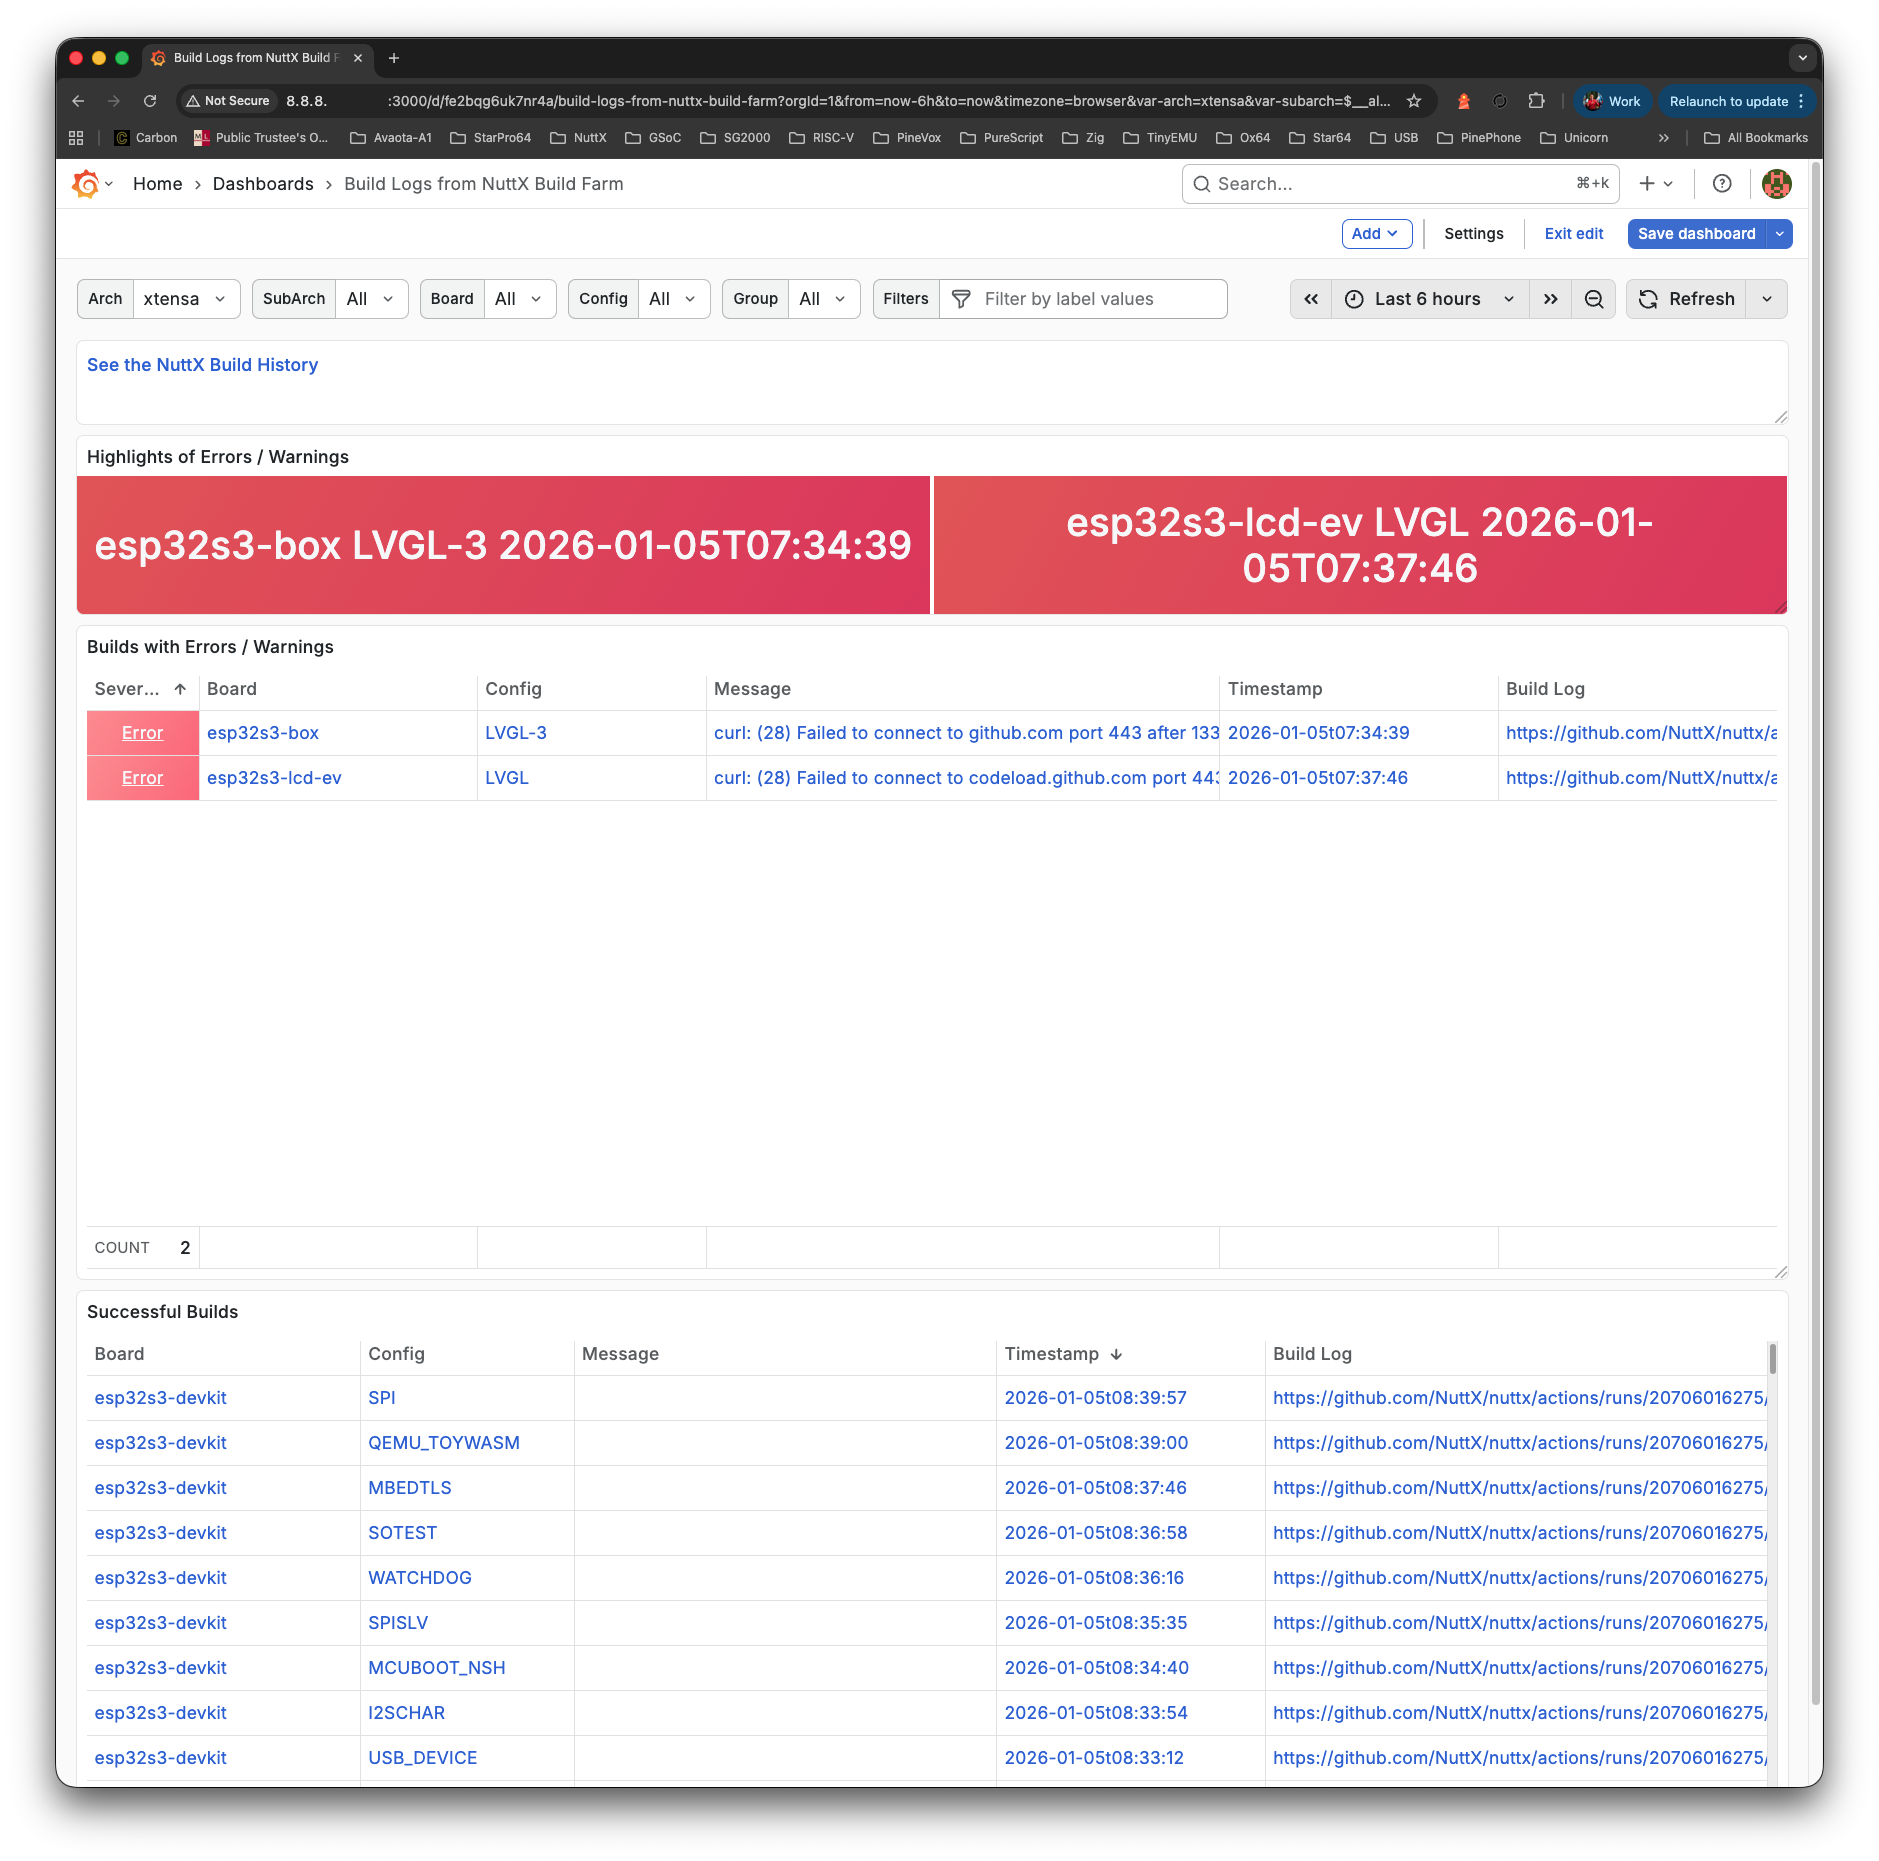
Check Grafana Dashboard at our External IP Address, port 3000. We’ll see the GitHub Actions Logs…
http://x.x.x.x:3000/d/fe2bqg6uk7nr4a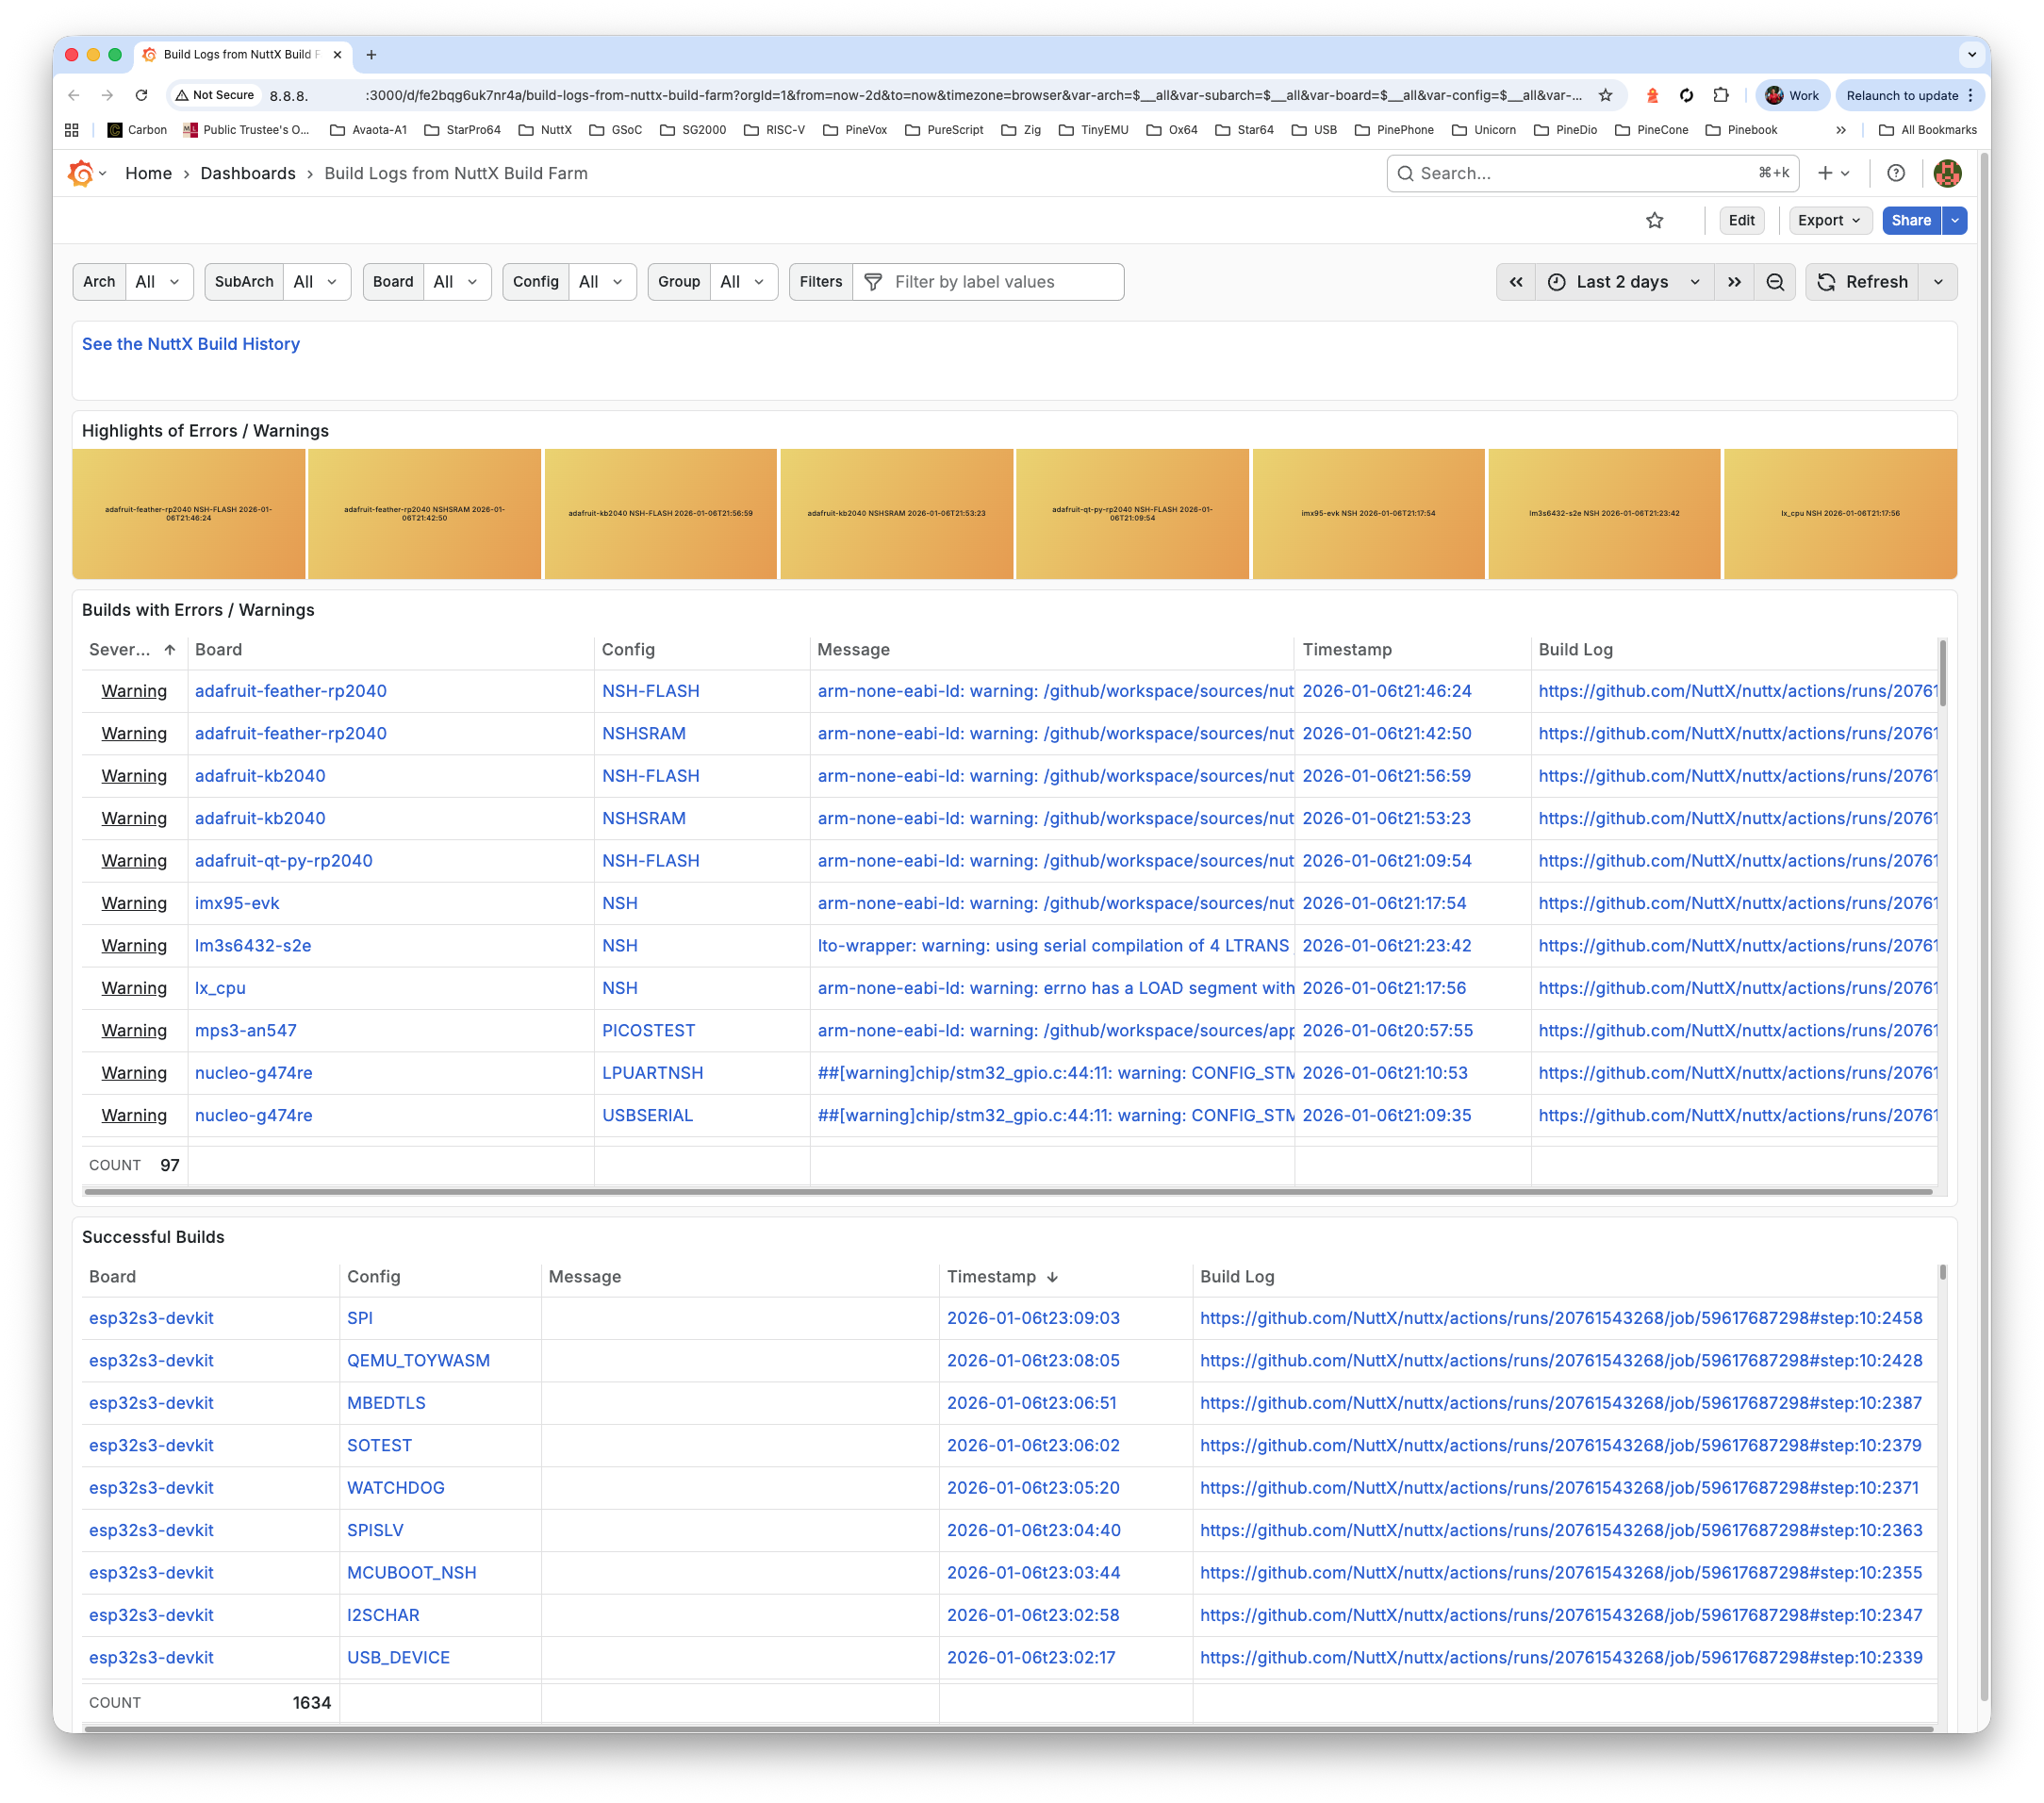
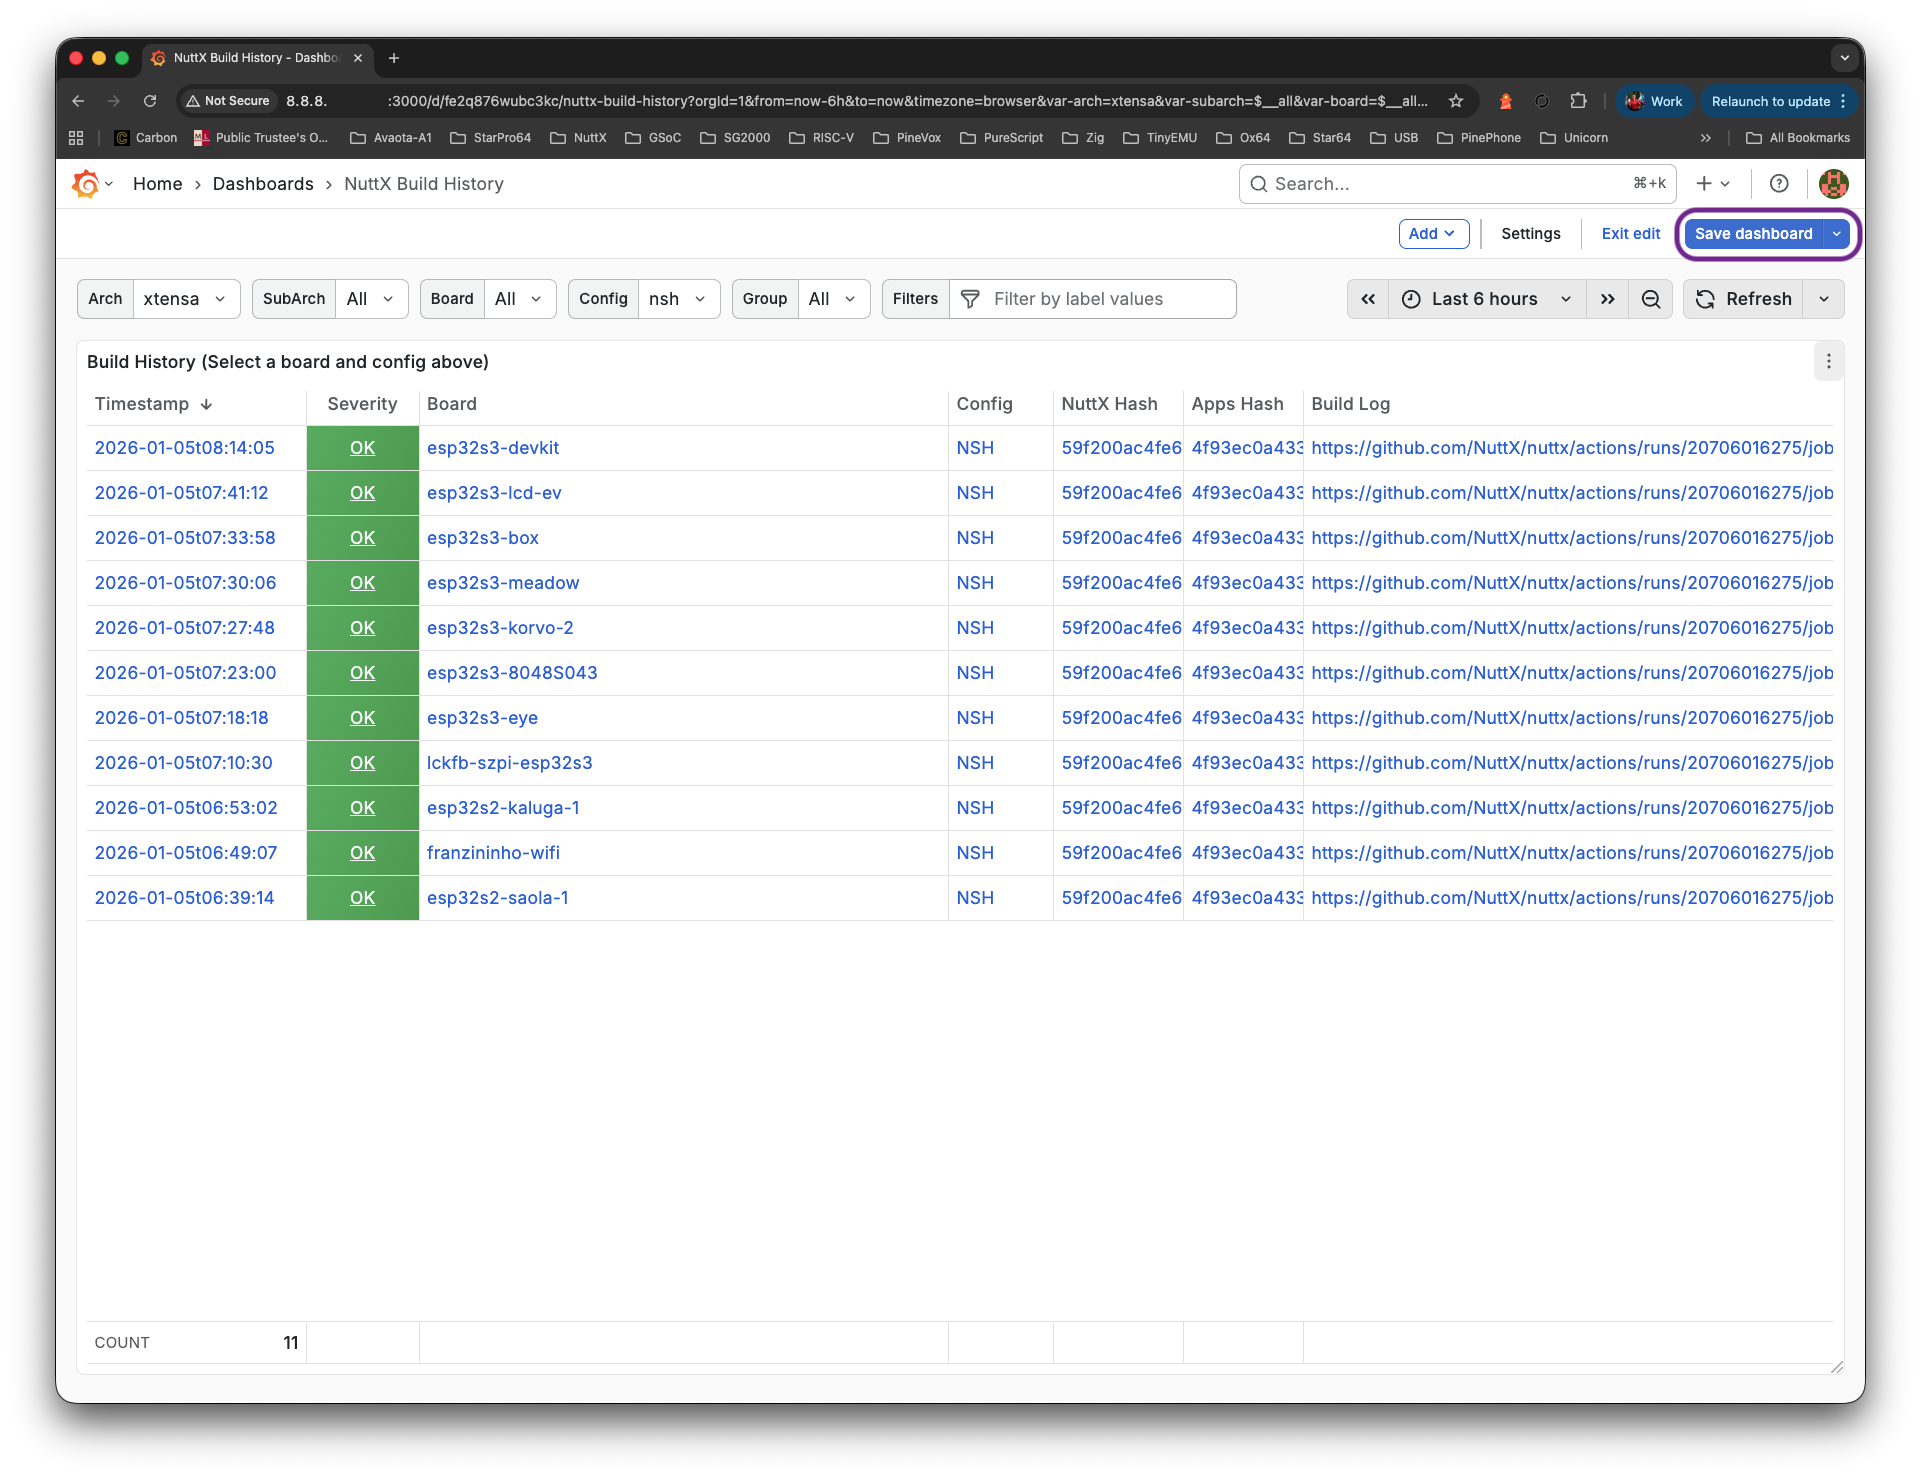
Finally check the Build History
http://x.x.x.x:3000/d/fe2q876wubc3kc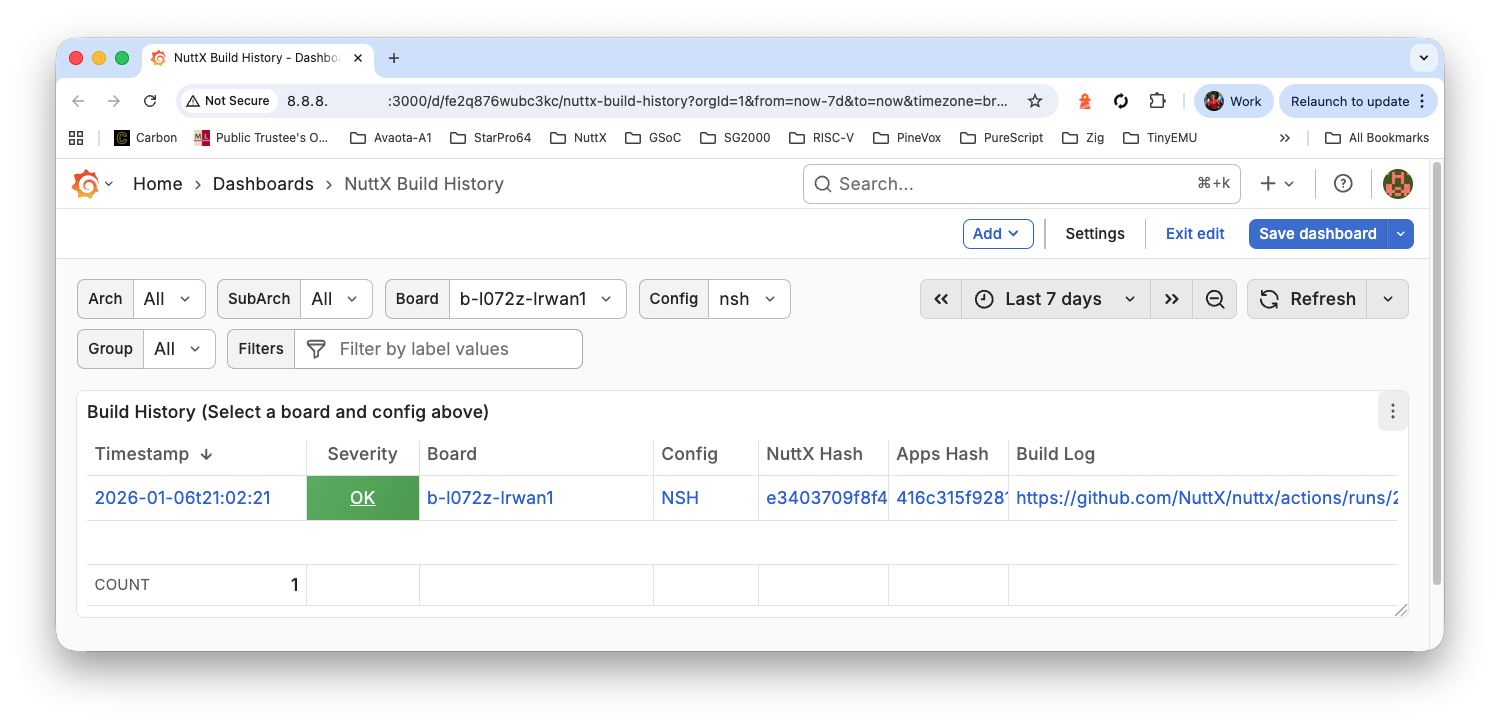
What triggers the Daily Build at NuttX Mirror Repo?
Our script sync-build-ingest.sh will trigger the Daily Build, followed by the ingestion of the GitHub Actions Logs.
Only one instance of sync-build-ingest.sh should ever be running! Make sure lupyuen isn’t running it on his Home Computer.
Inside our VM: Do this…
## Set the GitHub Token
. $HOME/github-token.sh
gh auth status

## We should see...
## ✓ Logged in to github.com account nuttxpr (GITHUB_TOKEN)
## - Active account: true
## - Git operations protocol: https
## - Token: ghp_************************************
## - Token scopes: 'read:org', 'repo'

## Configure the Git User
git config --global user.email "[email protected]"
git config --global user.name "nuttxpr (nuttx-dashboard-vm)"

## Start the NuttX Mirror Build and ingest the logs from GitHub Actions
## https://github.com/lupyuen/nuttx-release/blob/main/sync-build-ingest.sh
cd
git clone https://github.com/lupyuen/nuttx-release
cd $HOME/nuttx-release
./sync-build-ingest.sh

## If we see: "**** ERROR: Expected Downstream Commit to be 'Enable macOS Builds' but found: ..."
## Then run this instead:
## ./enable-macos-windows.sh
## ./sync-build-ingest.sh
(Log for sync-build-ingest.sh)
(Log for enable-macos-windows.sh)
We’ll see the “Enable macOS Patch” that starts the NuttX Build…
https://github.com/NuttX/nuttx/commits/master/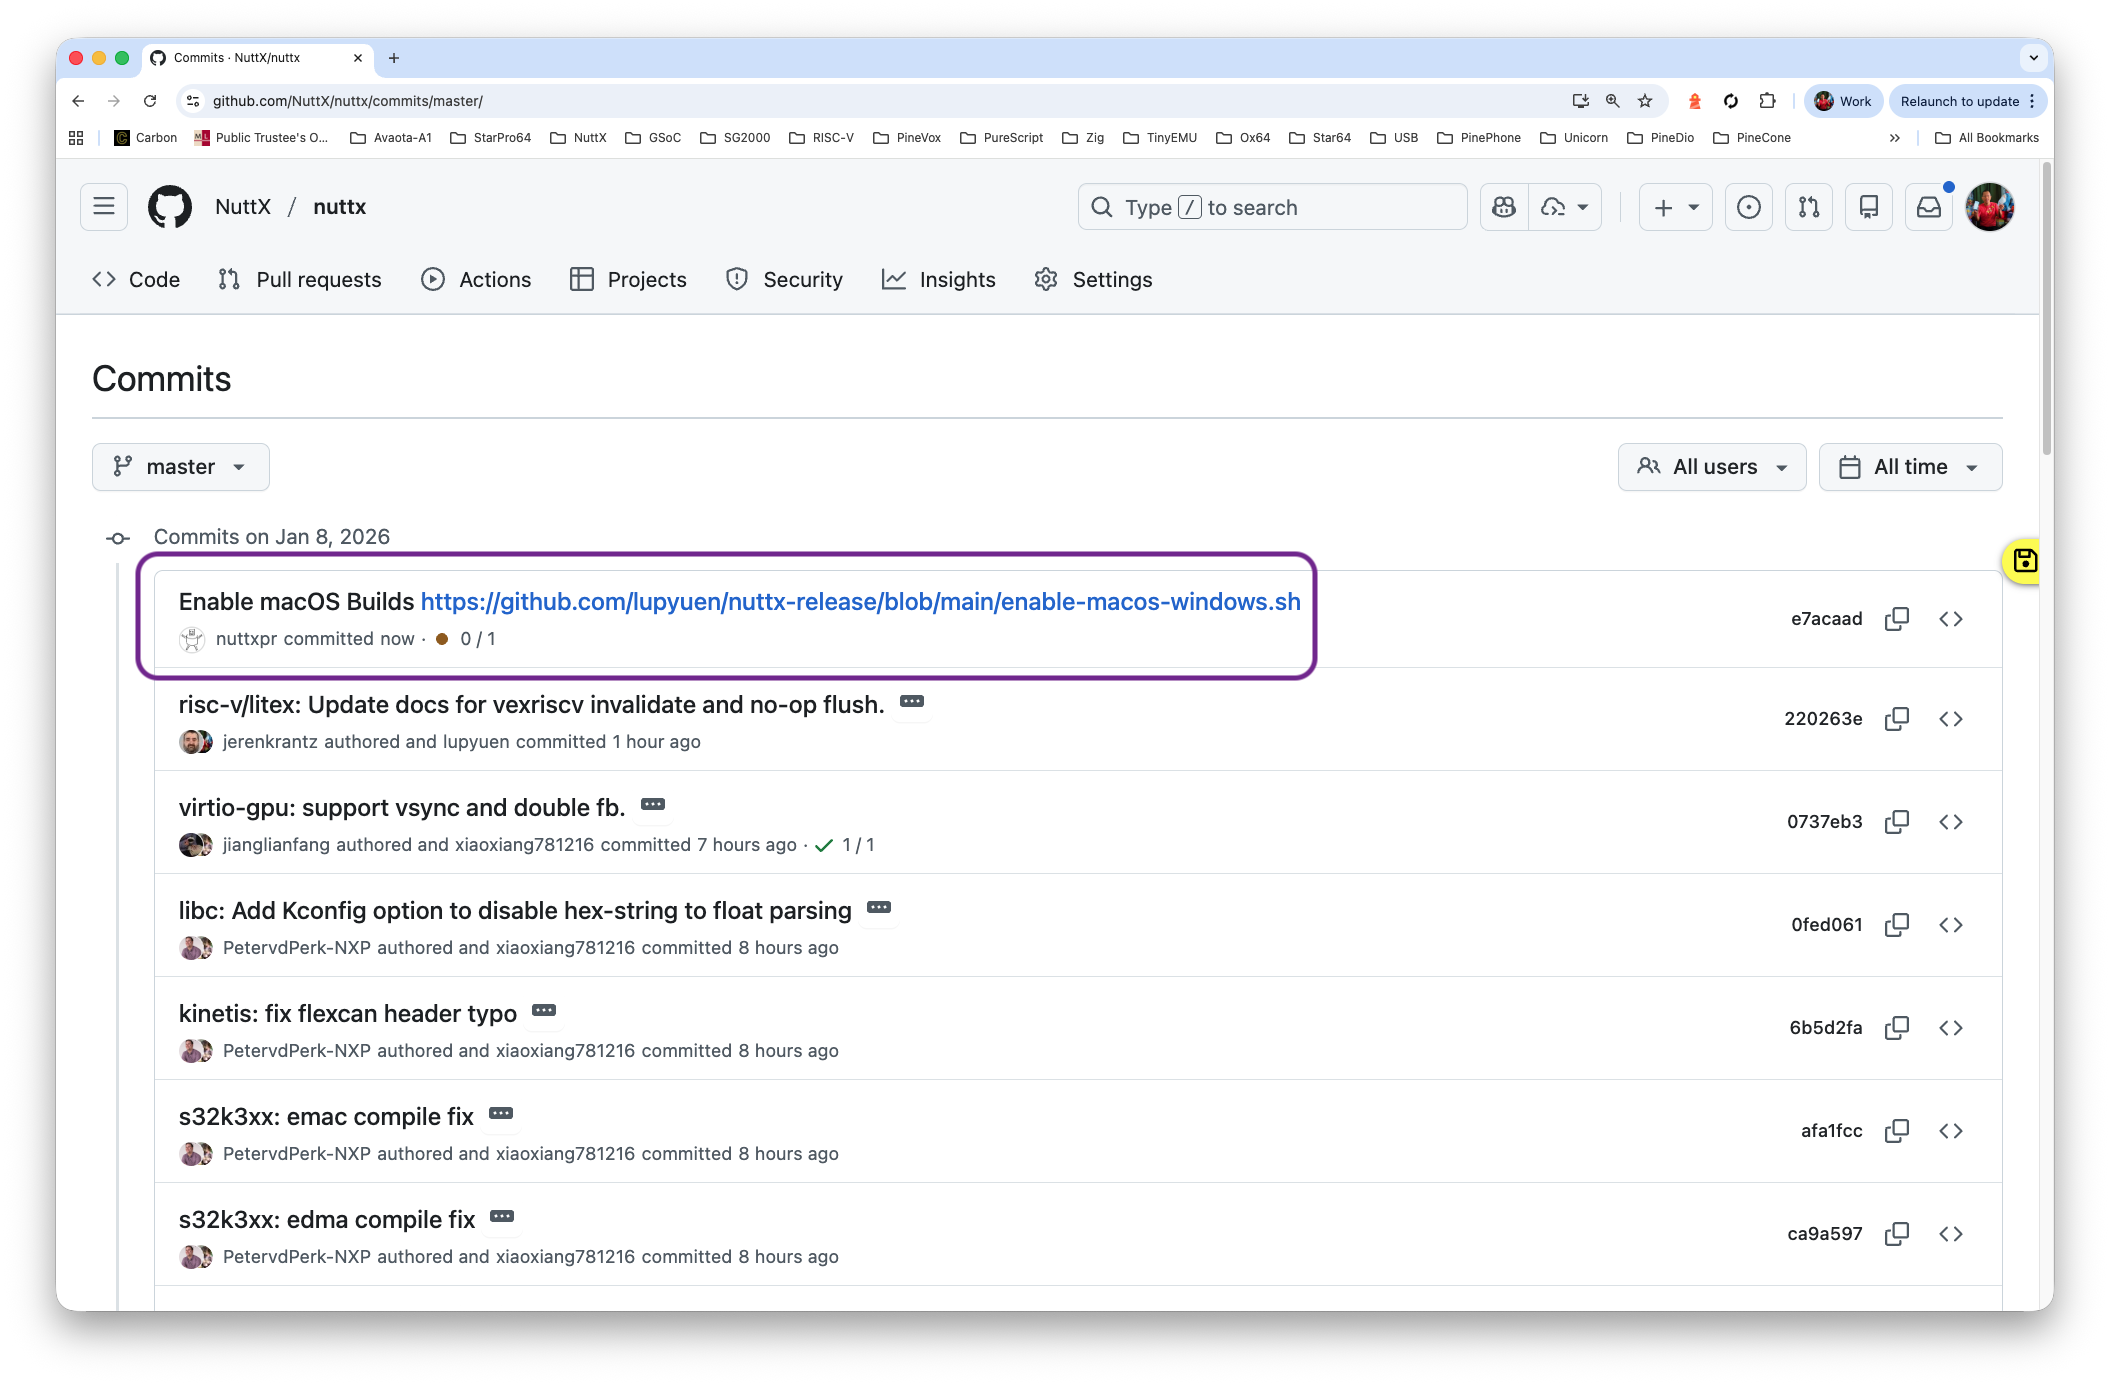
And the NuttX Build should be running…
https://github.com/NuttX/nuttx/actions/workflows/build.yml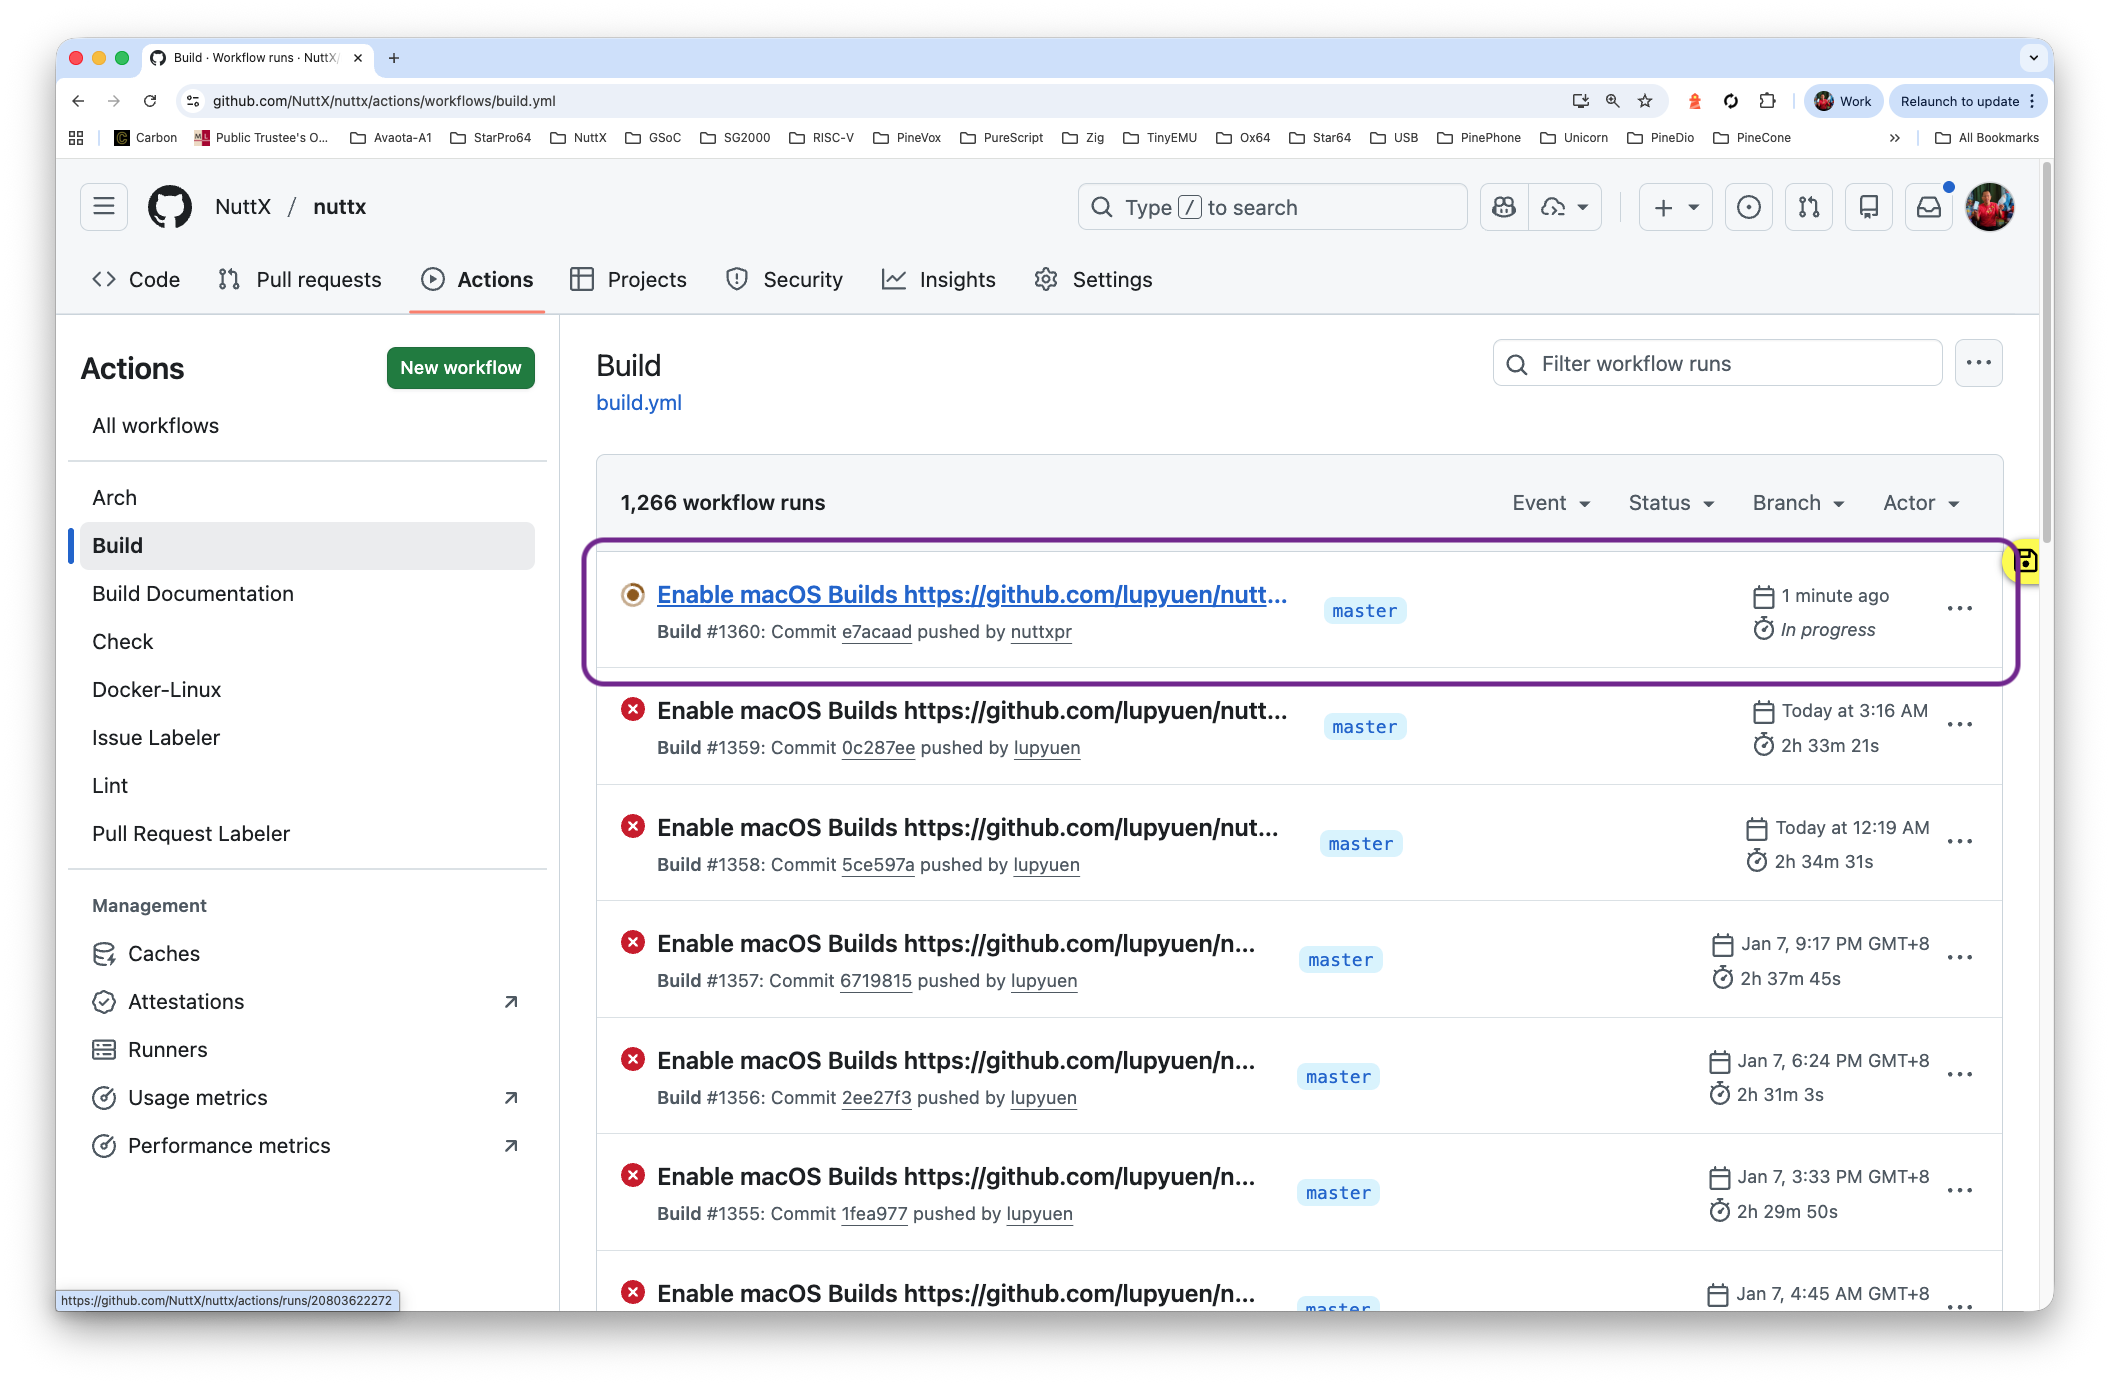
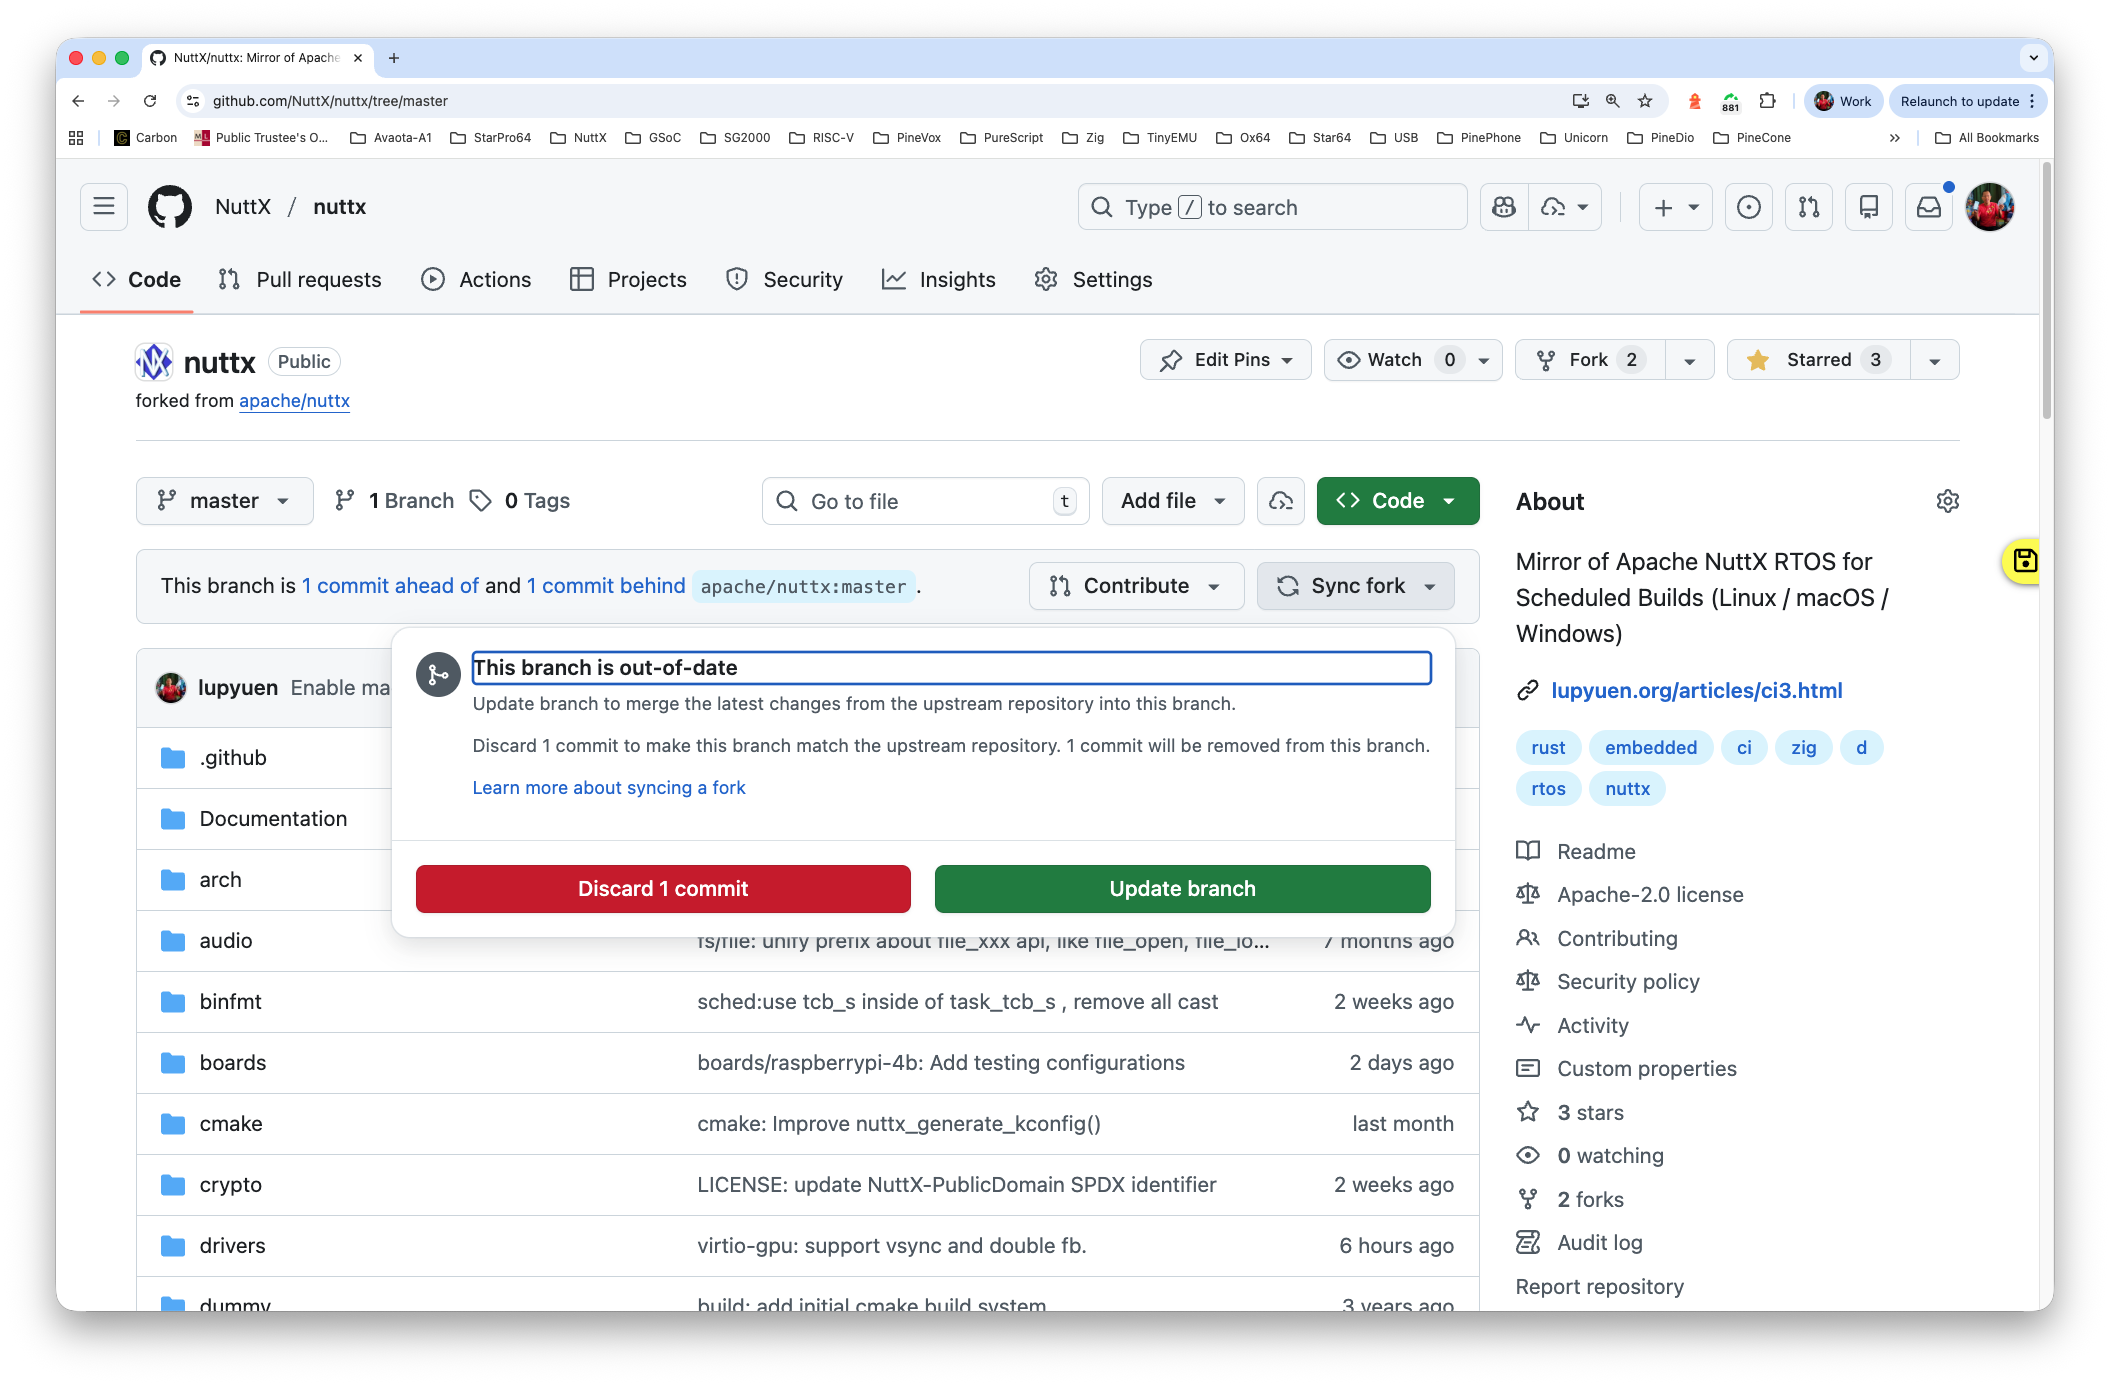
If the Patching and Building ain’t happening: Go to github.com/NuttX/nuttx, click “Sync Fork > Update Branch (or Discard Commit)” (pic below). Then run enable-macos-windows.sh followed by sync-build-ingest.sh.
If we see this error…
fatal: cannot create directory at 'arch/arm/src/kinetis':
No space left on device
warning: Clone succeeded, but checkout failed.
Then increase the Disk Space, we need 5 GB for /tmp…
Everything We’ve Done for NuttX Build and Ingest: Needs to be looped forever. Edit $HOME/sync.sh and fill this in…
#!/usr/bin/env bash
## Sync NuttX Mirror, Build NuttX Mirror and Ingest GitHub Actions Logs

set -x  #  Echo commands
. $HOME/github-token.sh
gh auth status

for (( ; ; )); do
  cd $HOME/nuttx-release
  ./sync-build-ingest.sh

  set +x ; echo "**** sync.sh: Waiting" ; set -x
  date ; sleep 900
done
Whenever our VM Boots: Run $HOME/sync.sh…
## Don't use cron, need to monitor manually so that
## we don't overuse the GitHub Runners of the Mirror Repo
sudo apt install tmux
tmux
chmod +x $HOME/sync.sh
$HOME/sync.sh

## If the SSH Session Disconnects:
## Do this to reconnect the sync.sh session...
## tmux a
(Log for NuttX Build and Ingest)
One More Step: We need to ingest the GitHub Gists and GitLab Snippets (and compute the metrics)…
In Case of Sync Problems: Go to github.com/NuttX/nuttx, click “Sync Fork > Update Branch (or Discard Commit)”. Then run enable-macos-windows.sh followed by sync.sh. (Hmmm this seems to happen often in our VM. Why?)
We’re ready to Go Live! We tweak some Grafana Settings to make NuttX Dashboard more secure.
Inside our VM: Edit /etc/grafana/grafana.ini. Look for these settings and change them (don’t add them)
# Default UI theme ("dark", "light" or "system")
# Default: default_theme = dark
default_theme = light

# Path to a custom home page. Users are only redirected to this if the default home dashboard is used. It should match a frontend route and contain a leading slash.
# Default: home_page =
home_page = /d/fe2bqg6uk7nr4a

# Disable usage of Grafana build-in login solution.
# Default: disable_login = false
disable_login = true

# Set to true to disable (hide) the login form, useful if you use OAuth, defaults to false
disable_login_form = true

# enable anonymous access
# Default: enabled = false
enabled = true

# specify organization name that should be used for unauthenticated users
org_name = Main Org.

# specify role for unauthenticated users
org_role = Viewer

# mask the Grafana version number for unauthenticated users
# Default: hide_version = false
hide_version = true
(See the modified grafana.ini)
Restart Grafana…
sudo systemctl restart grafana-serverPublish online our NuttX Dashboard with Cloudflare Tunnel or another CDN…
NuttX Dashboard is ready to serve. Yay!
If we wish to allow Web Crawlers to index our Grafana Server…
Edit /usr/share/grafana/public/robots.txt
Change…
Disallow: /To…
Disallow: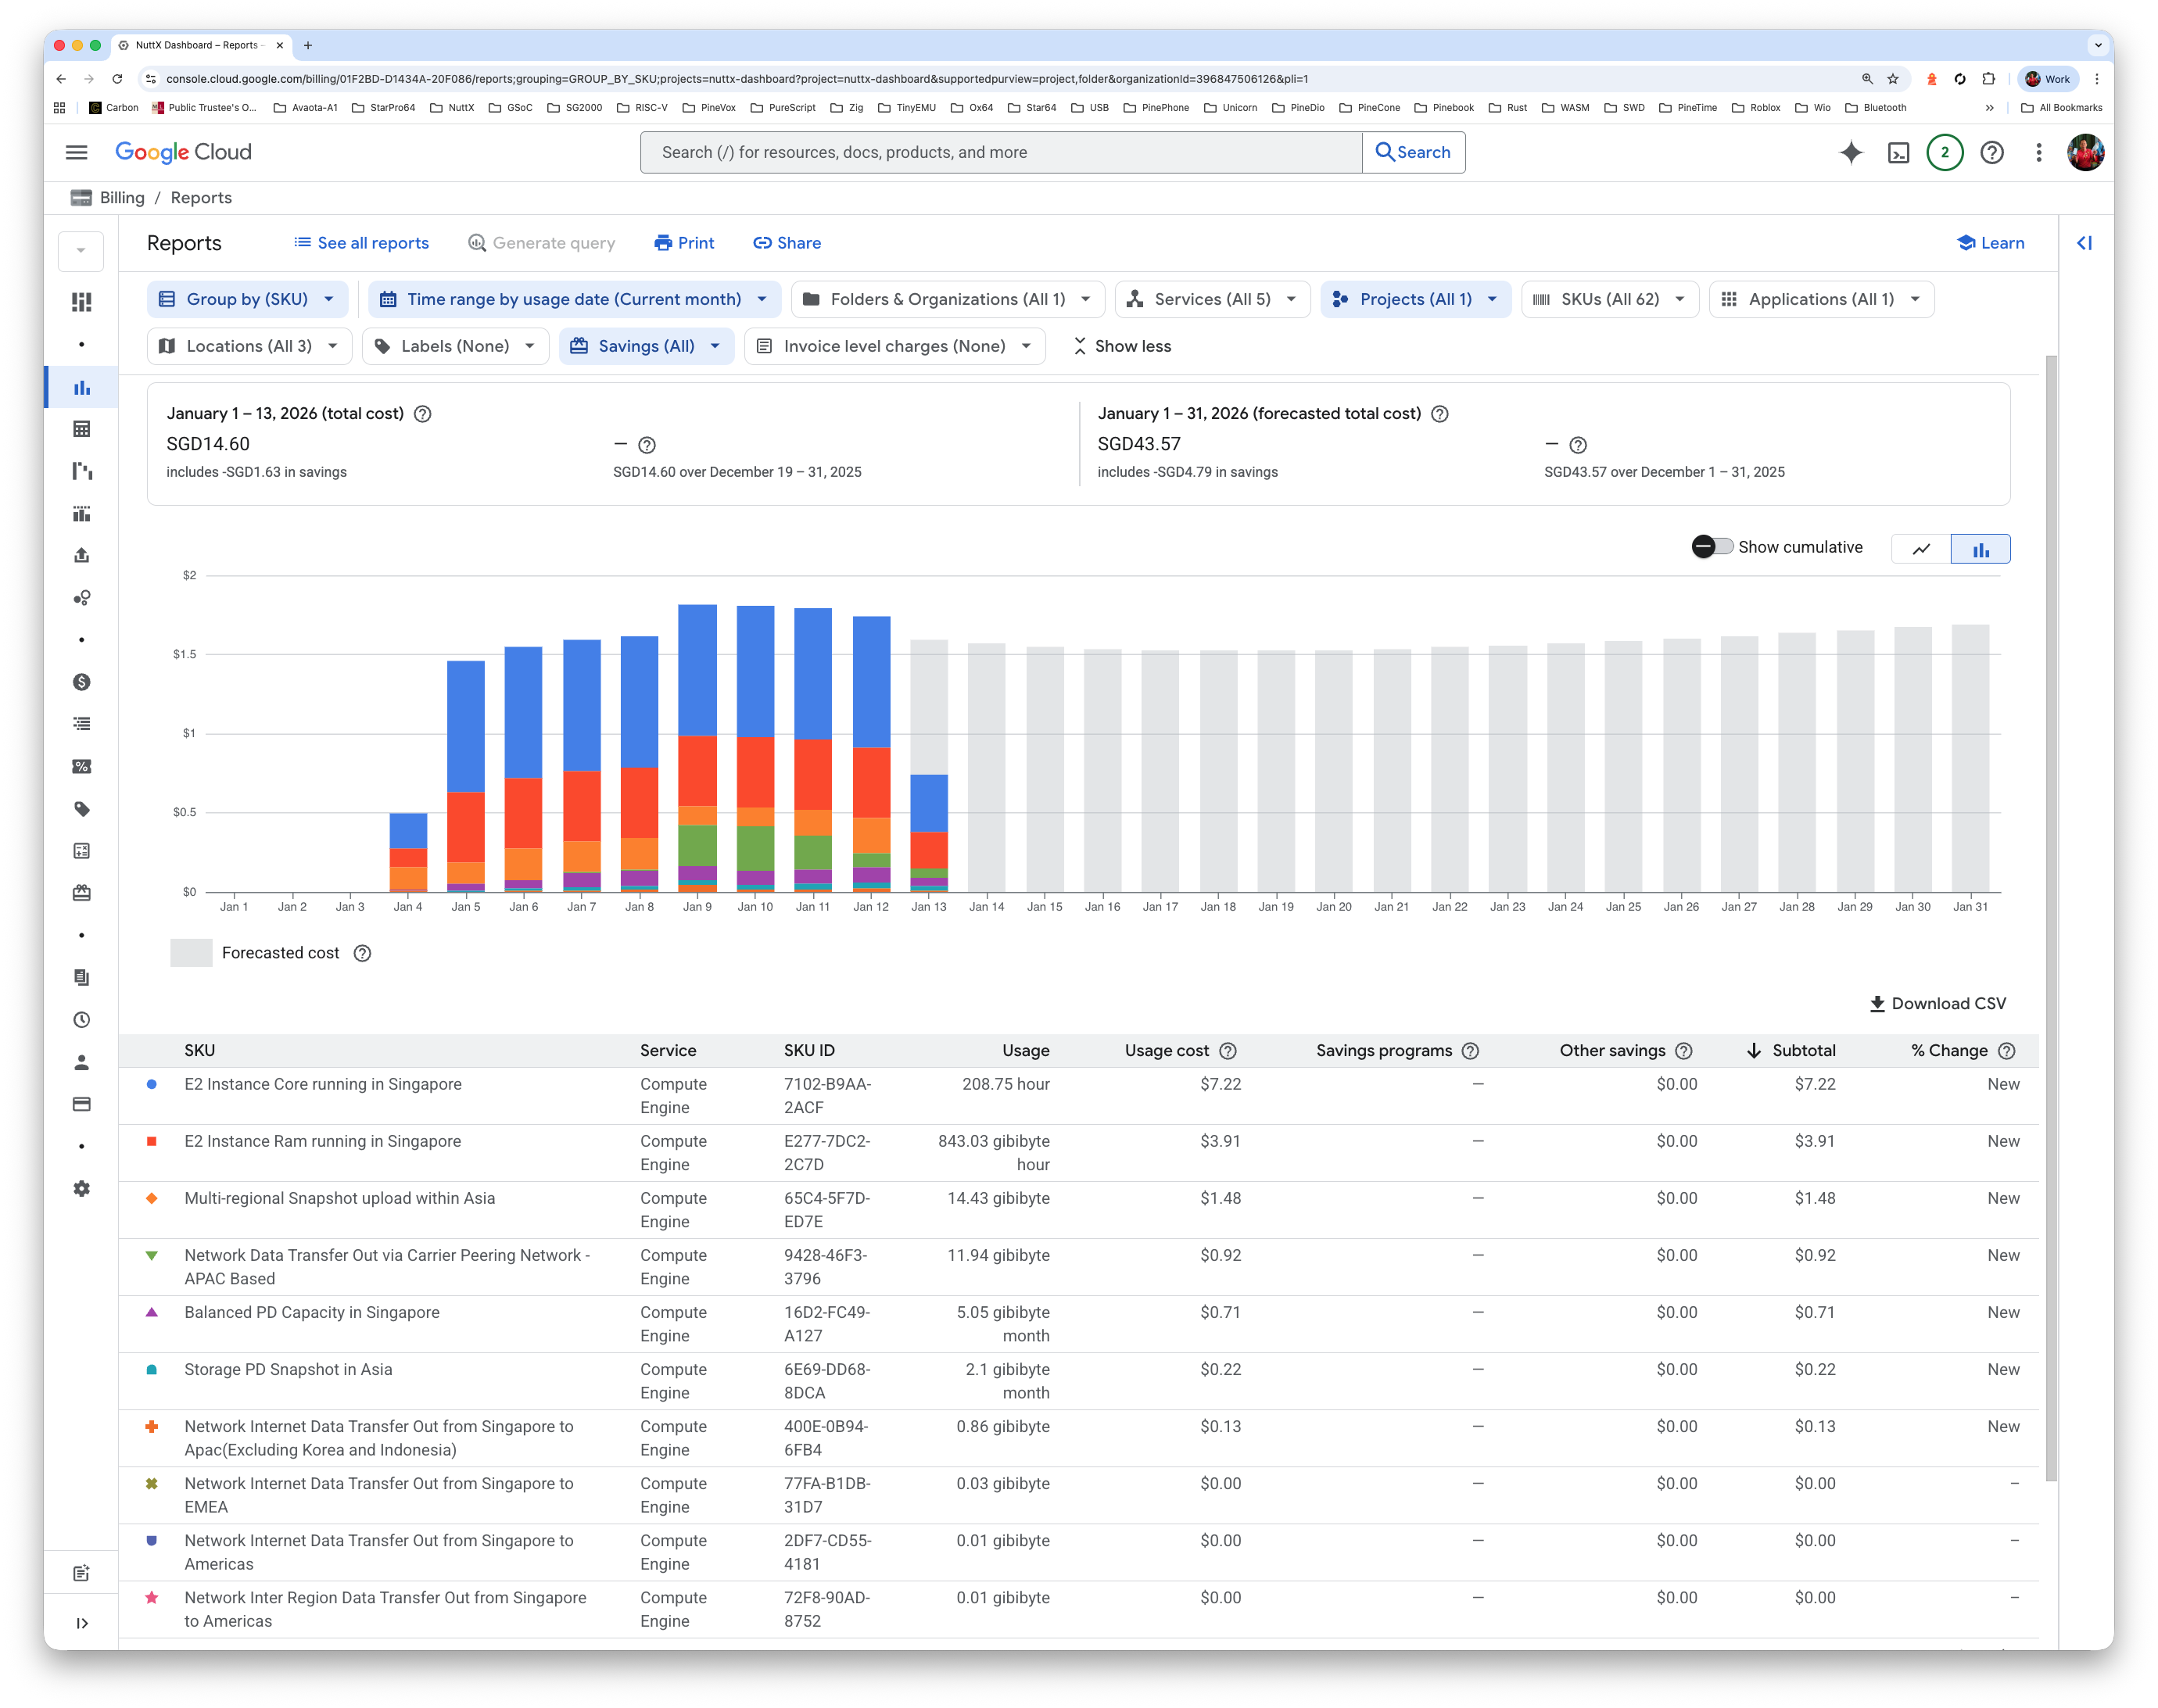
Hosting our dashboard on Google Cloud: Is it expensive?
NuttX Dashboard on Google Cloud VM (pic above) is costing us…
USD 1.24 per day
USD 38 per month
USD 453 per year
Since we have Zero Budget for NuttX Dashboard: We’ll pay this out of our own pocket.
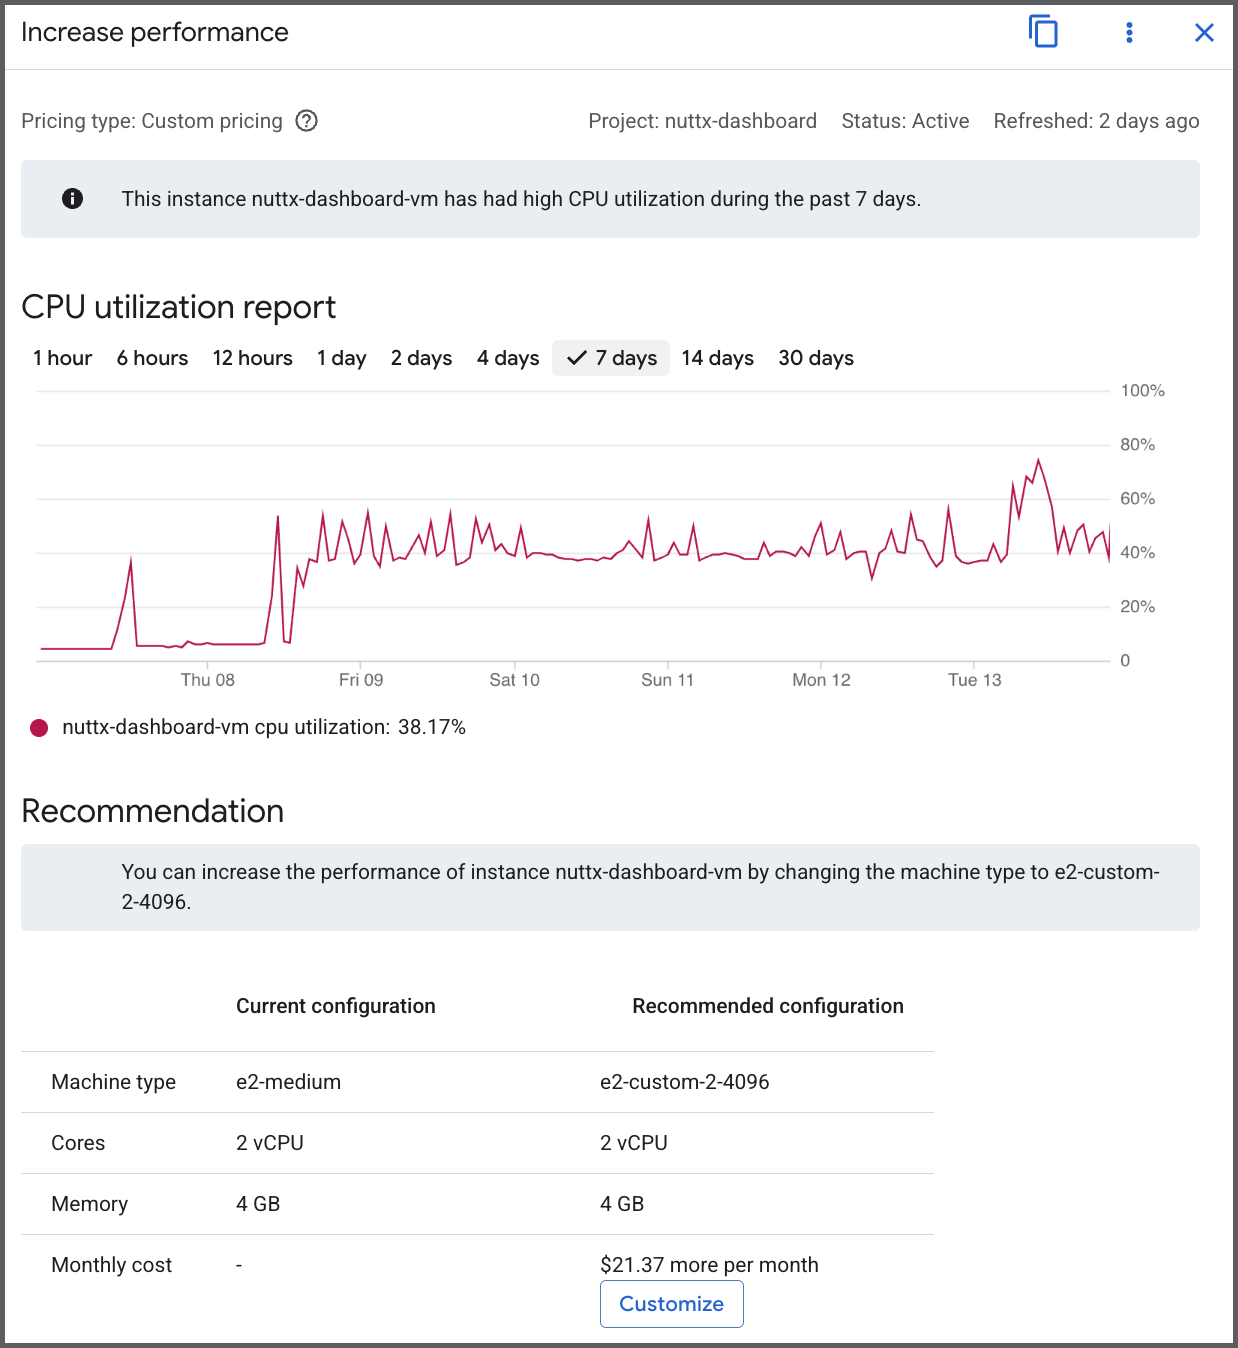
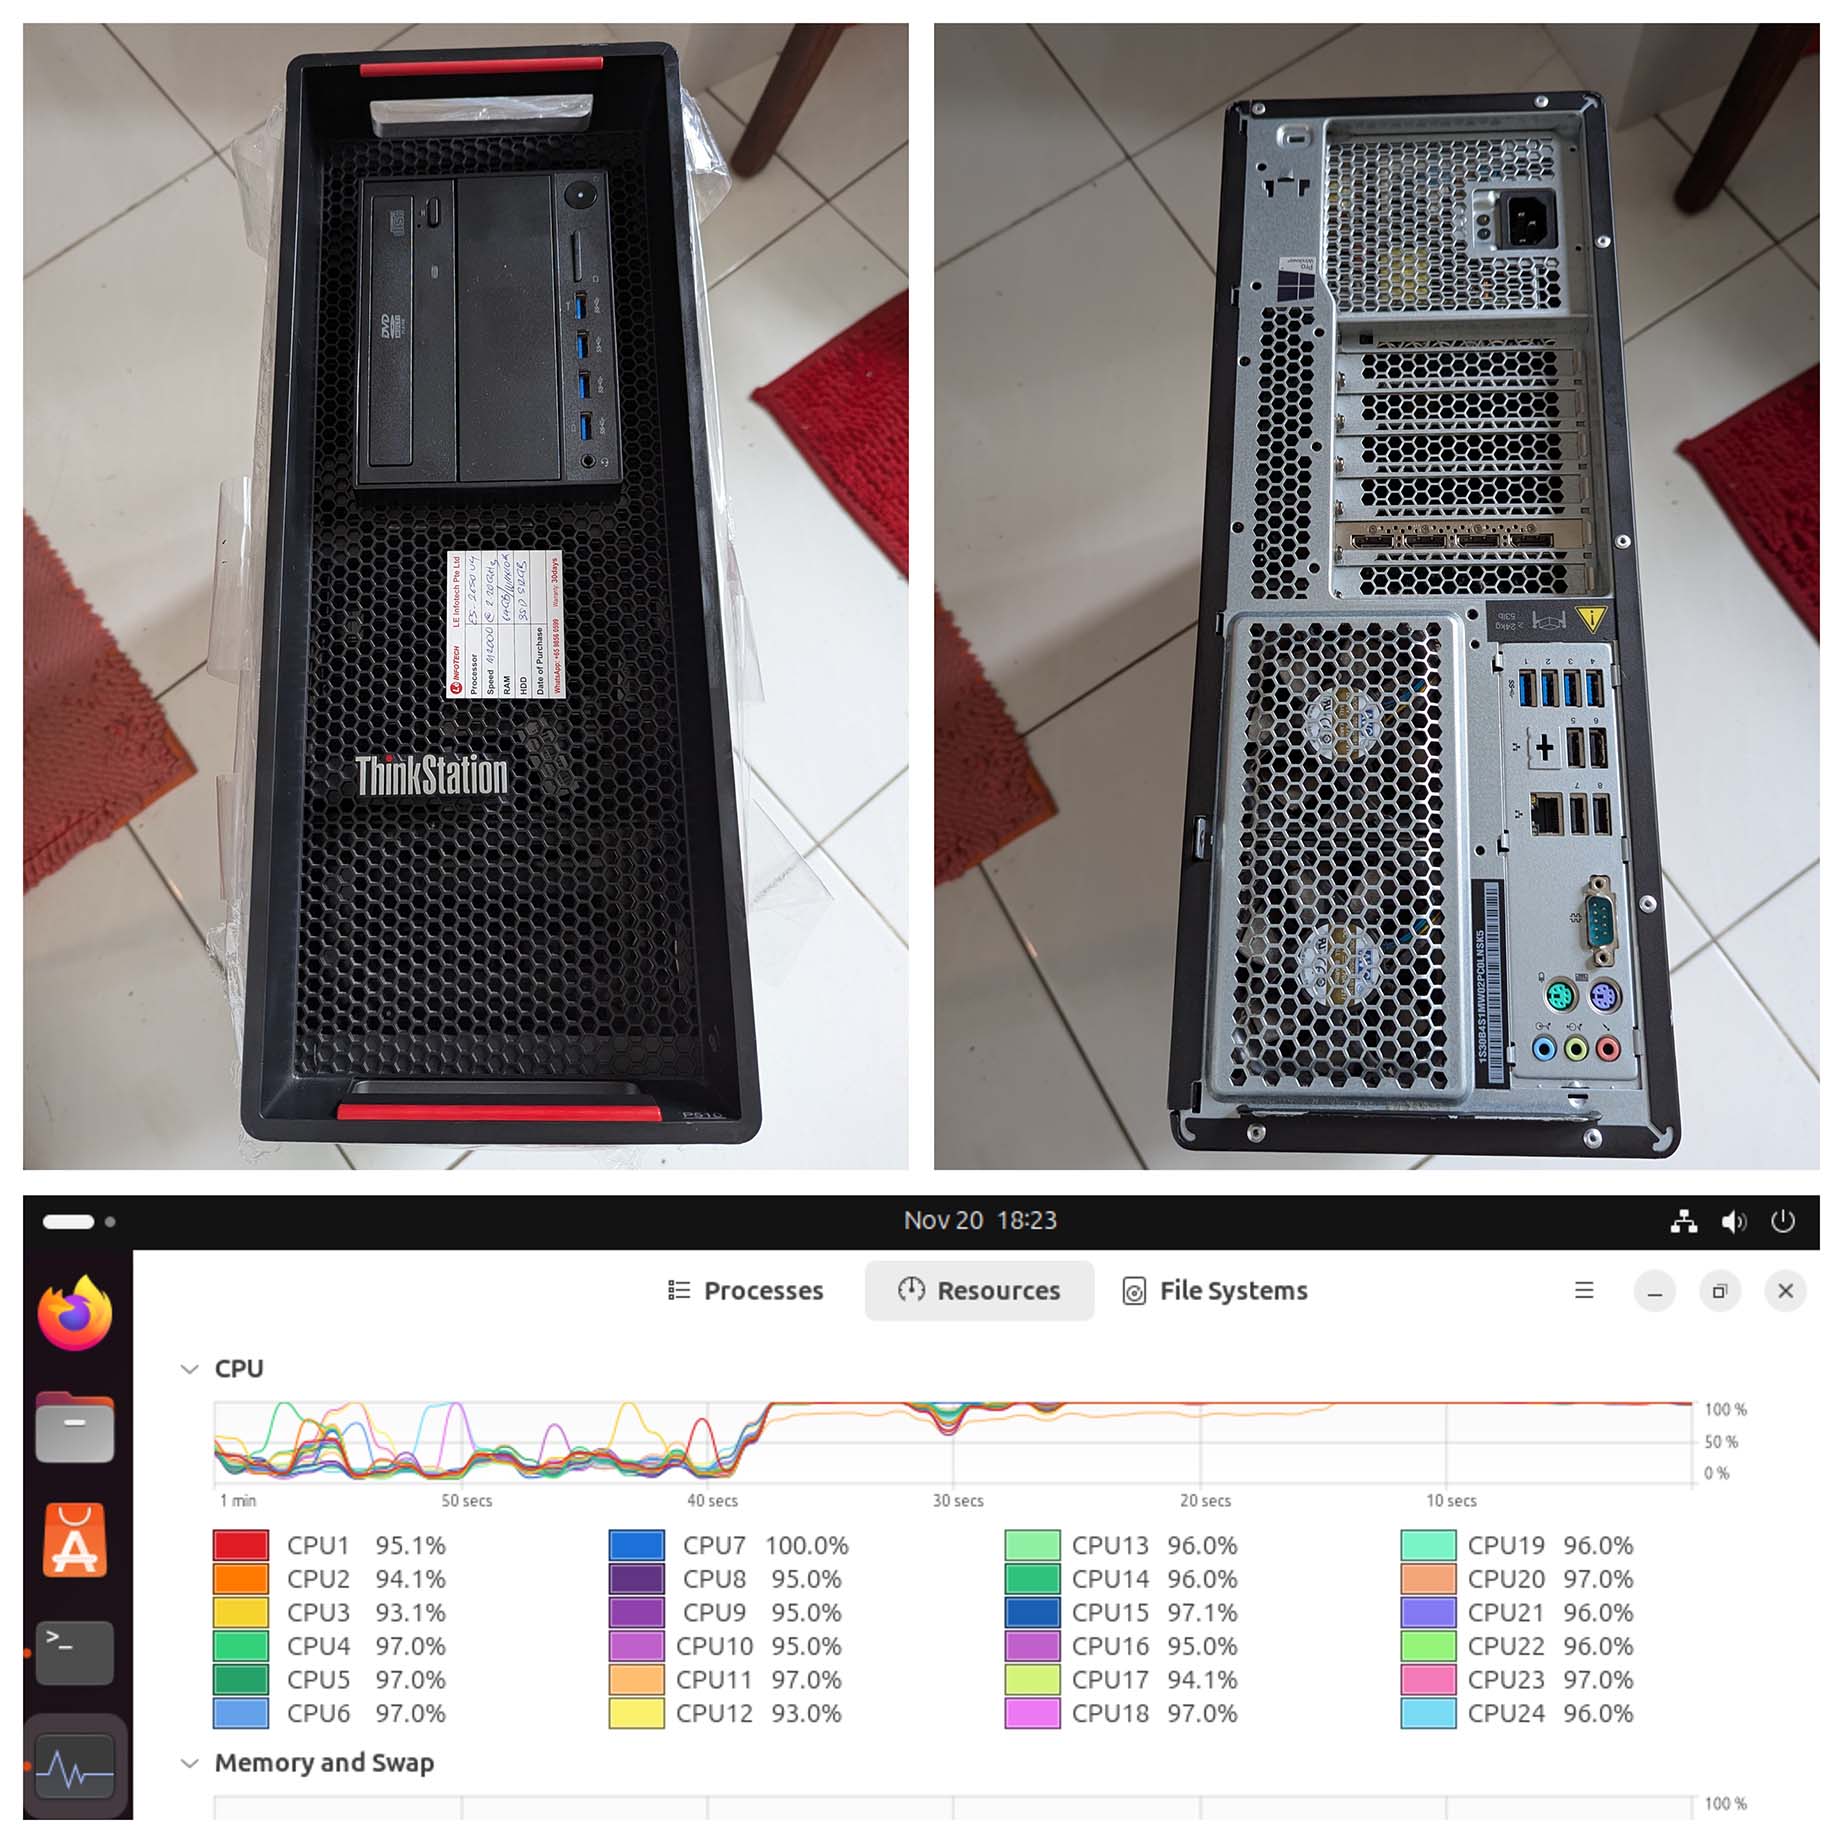
How’s our VM Utilisation?
Our VM runs continuously at 50% CPU (pic above), forever busy ingesting the NuttX Build Logs.
Google recommends that we bump up the VM Capacity, increasing USD 16 per month. Yikes!
Will it be cheaper on an Asian Cloud? Like AliCloud?
Hmmm interesting… We should try it sometime!
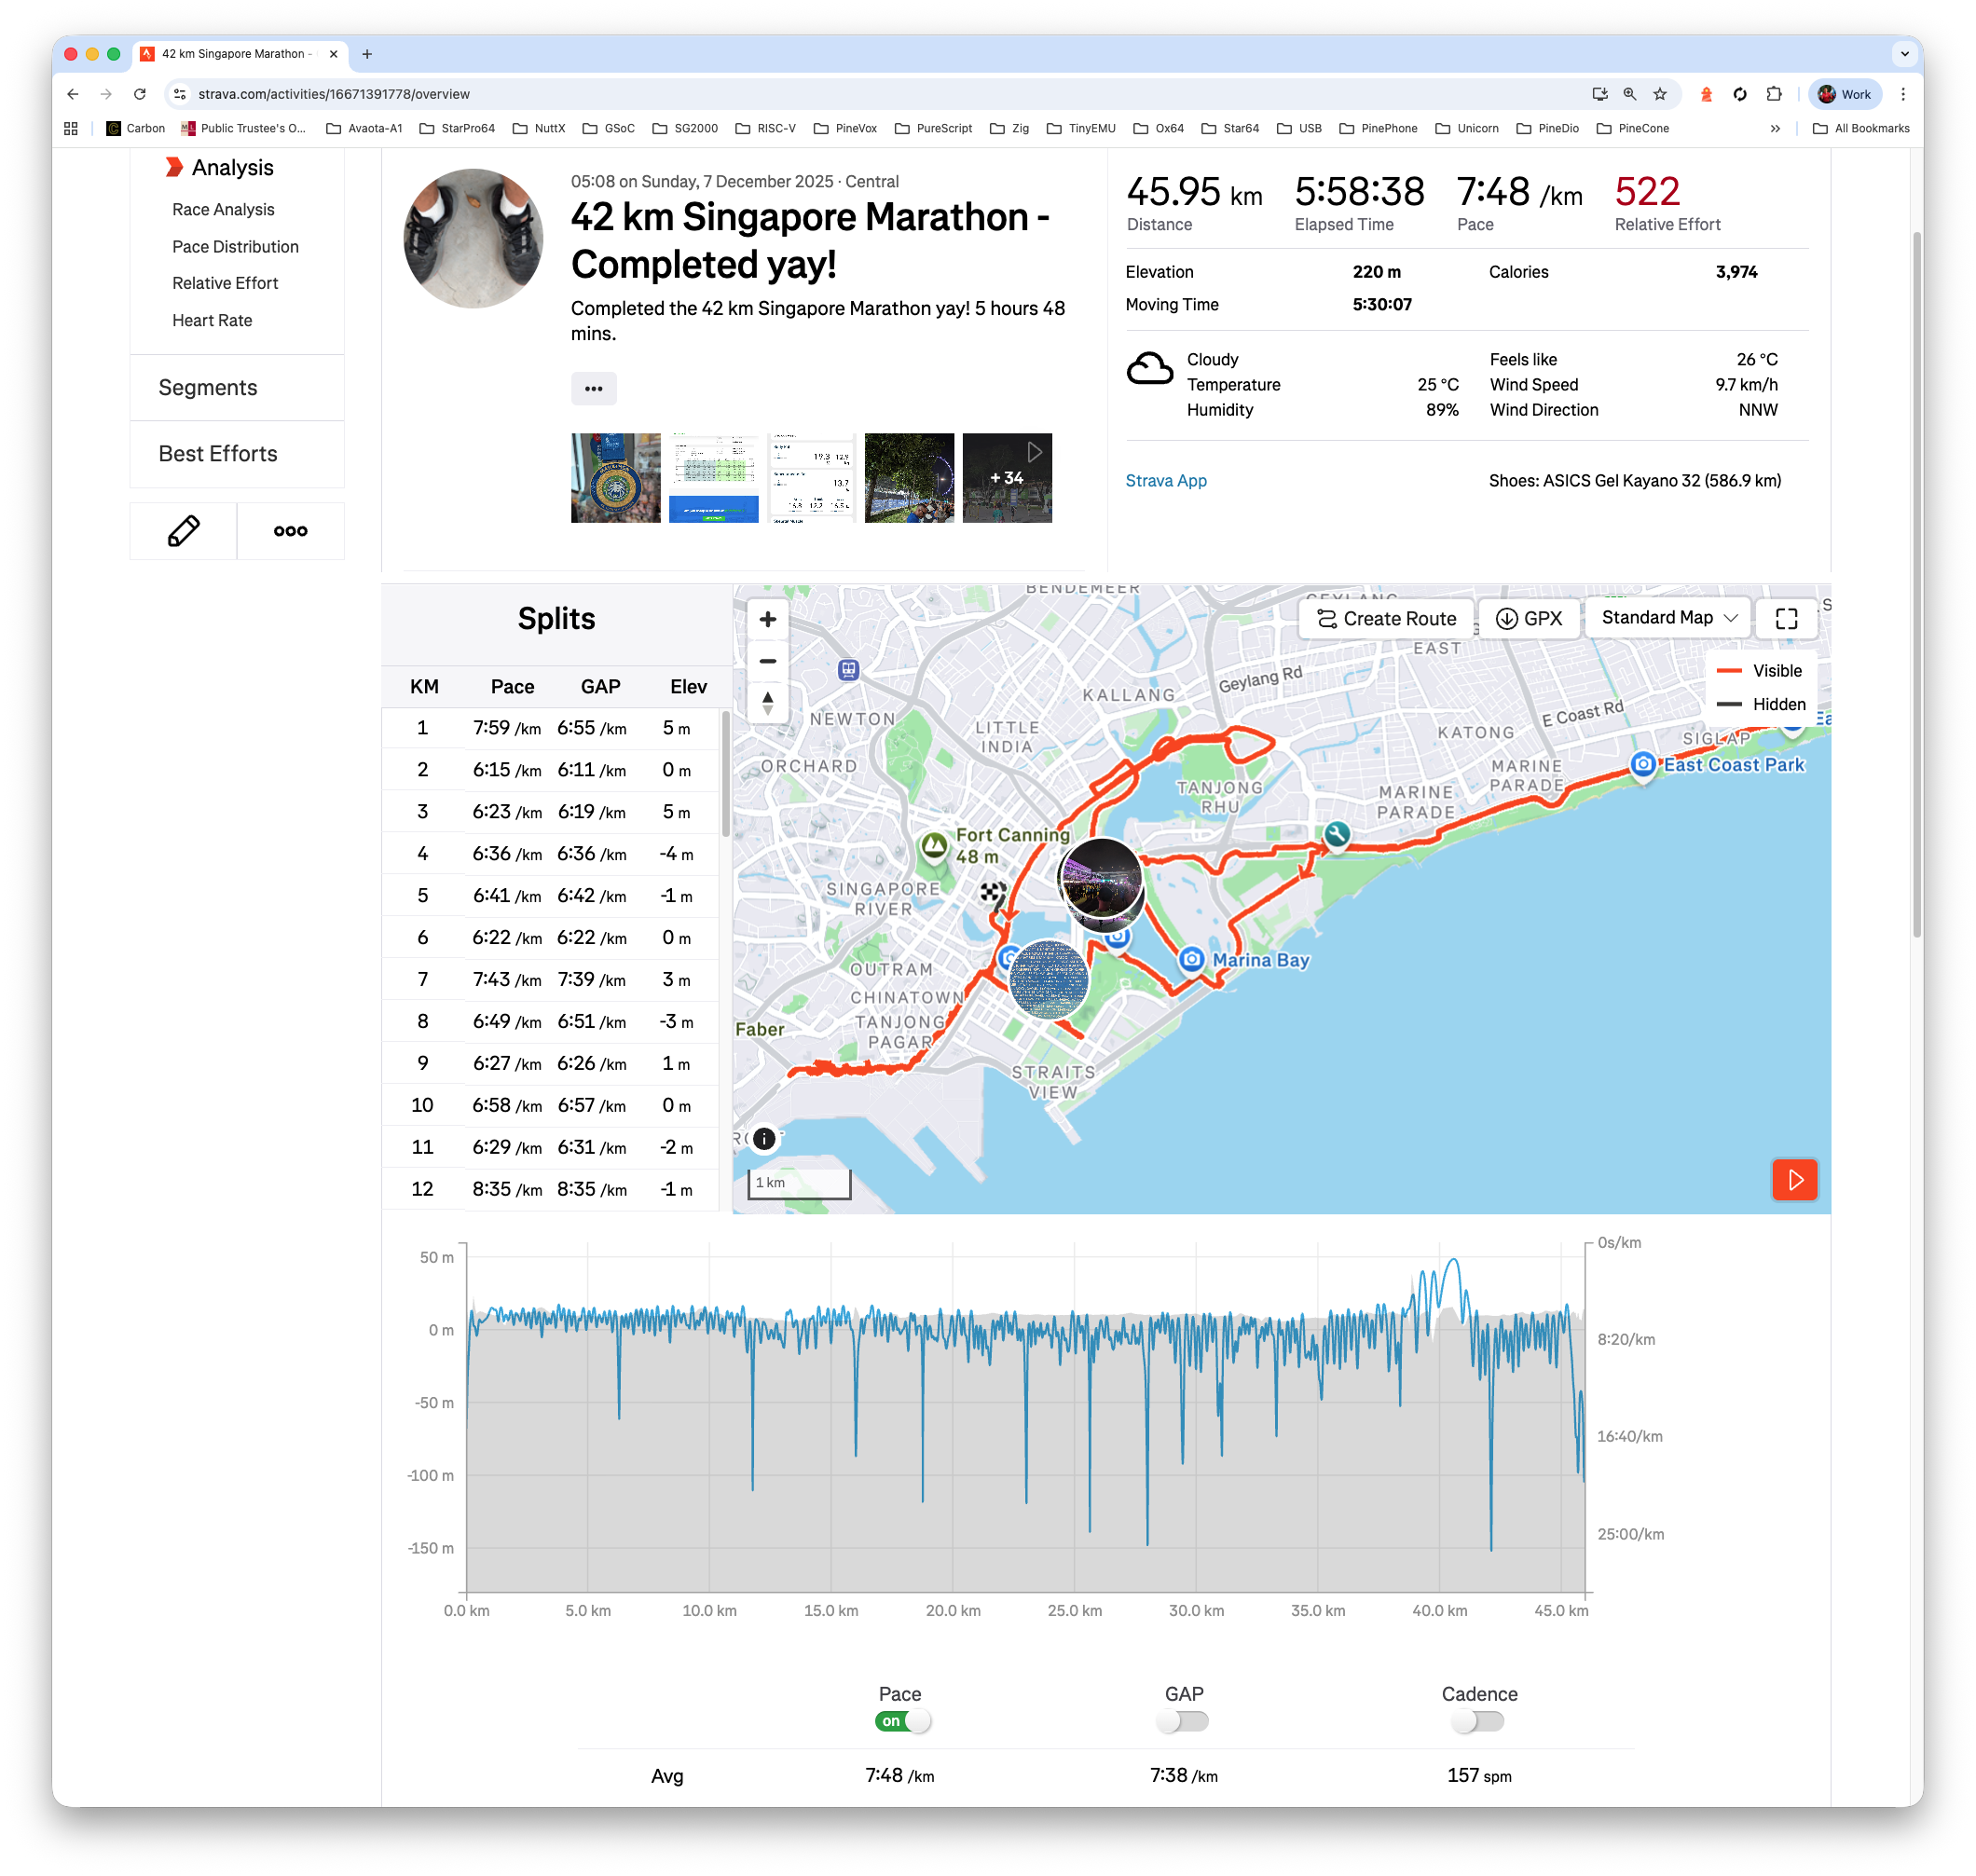
42 km Singapore Marathon - Completed yay!
Now that NuttX Dashboard is running in the Cloud (and not at Home)… We’re going overseas for Twincity Marathon!
Anything else we’re running on our Home Computer?
Yeah sadly these home-based NuttX Monitoring Jobs will probably stop running while we’re overseas for Marathon Races…
Can’t we run NuttX Build Farm in the Cloud?
Noooo…. Too expensive! Much cheaper with a Refurbished Ubuntu Xeon Server.
Special Thanks to My Sponsors for supporting my writing. Your support means so much to me 🙏
Got a question, comment or suggestion? Create an Issue or submit a Pull Request here…
What triggers the Daily Build at NuttX Mirror Repo?
Our script sync-build-ingest.sh will trigger the Daily Build, followed by the ingestion of the GitHub Actions Logs.
Inside the script: Our Regular GitHub Account nuttxpr will start the build by pushing a patch to the NuttX Mirror Repo (pic above). This is how we grant the Push Permission to nuttxpr…
Browse to the Collaborators for NuttX Mirror Repo
https://github.com/NuttX/nuttx/settings/accessClick “Add People”
Enter nuttxpr
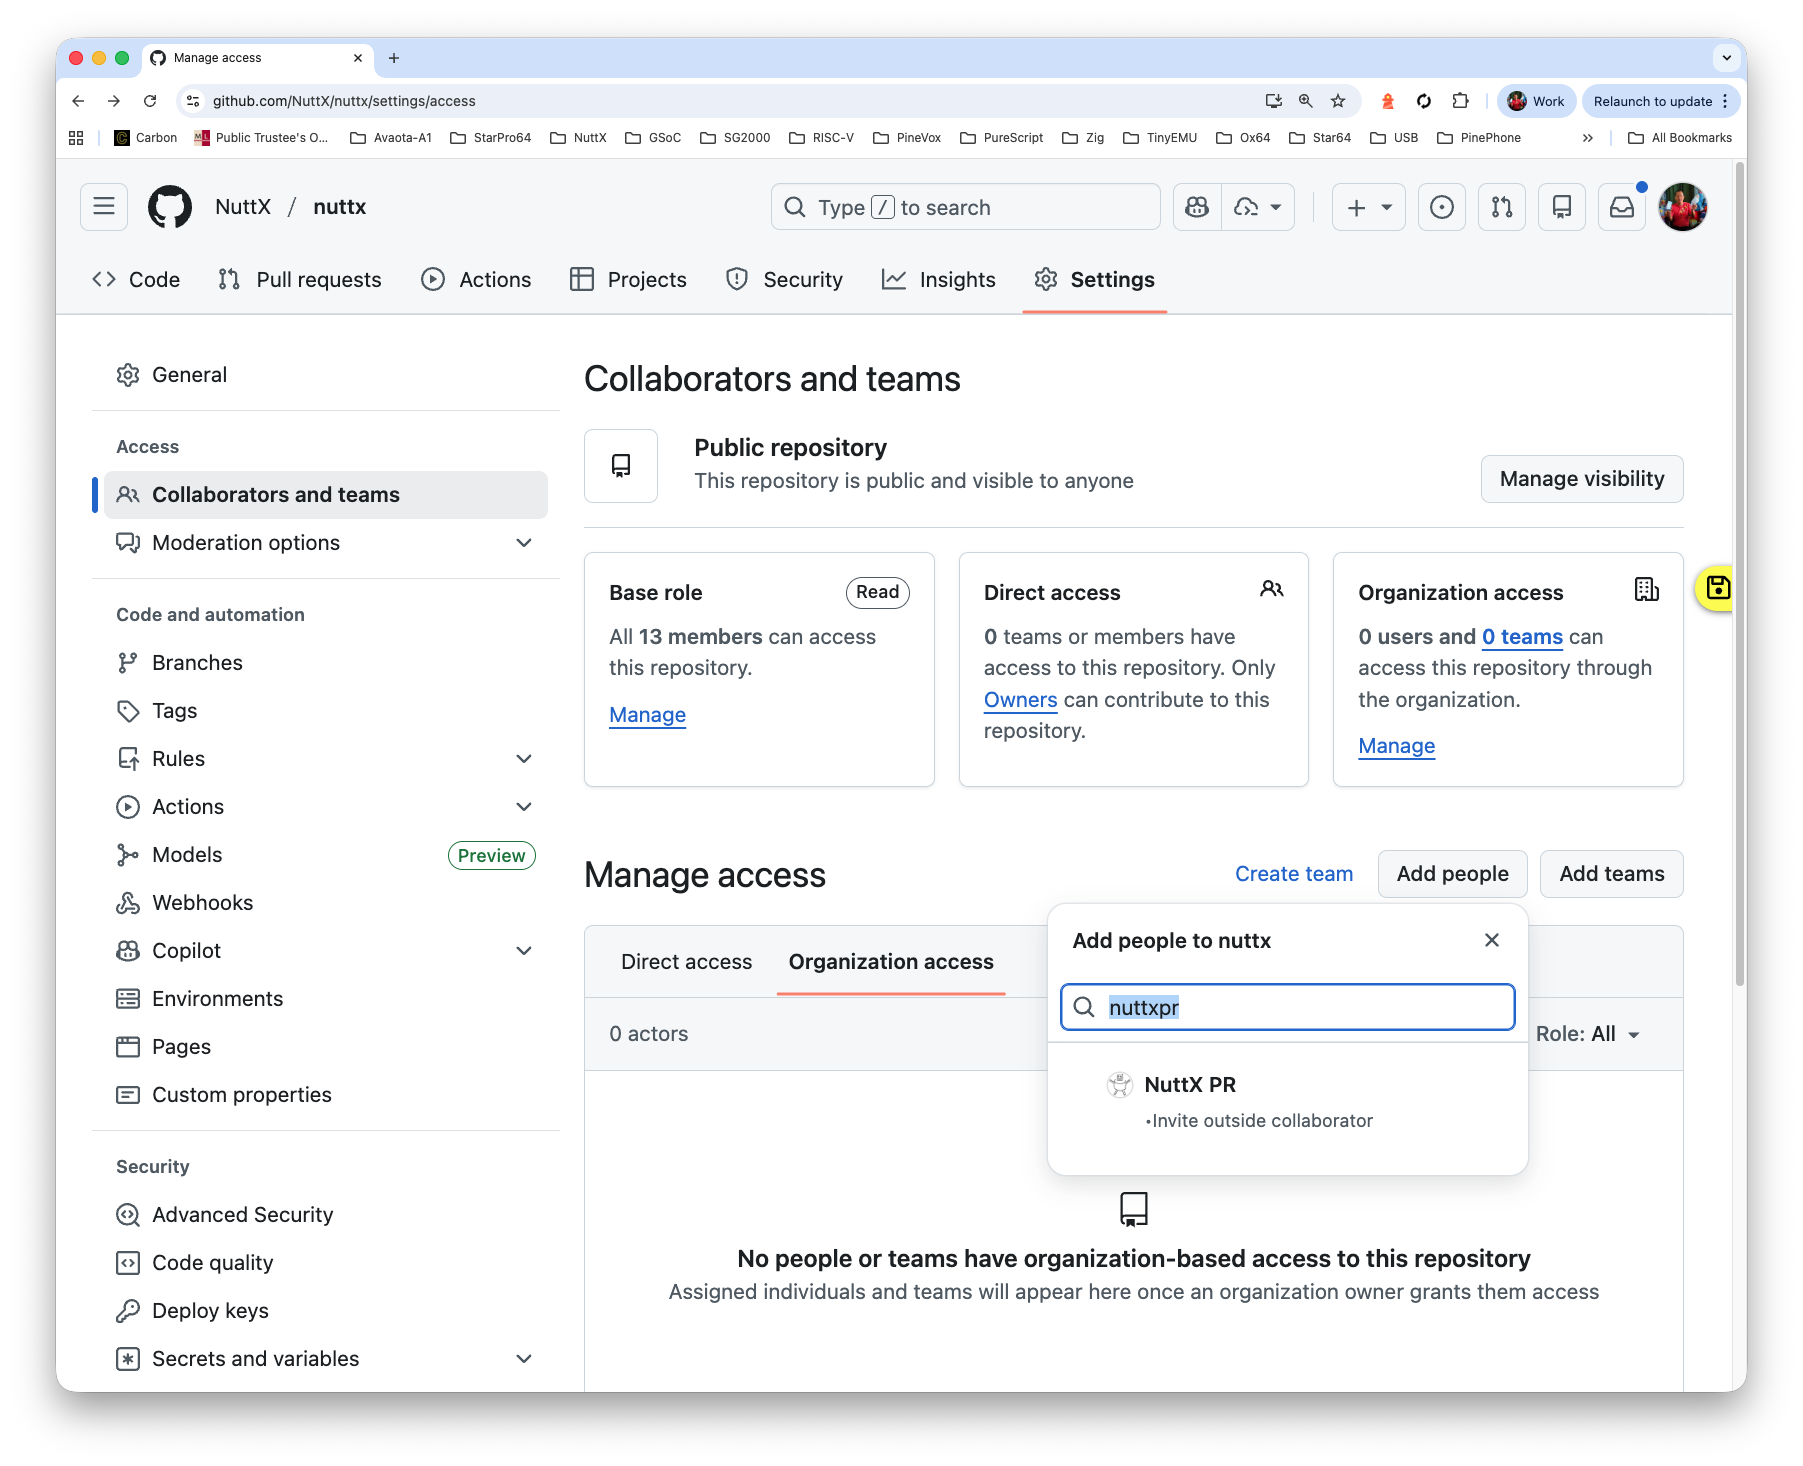
Set the Role to “Write”
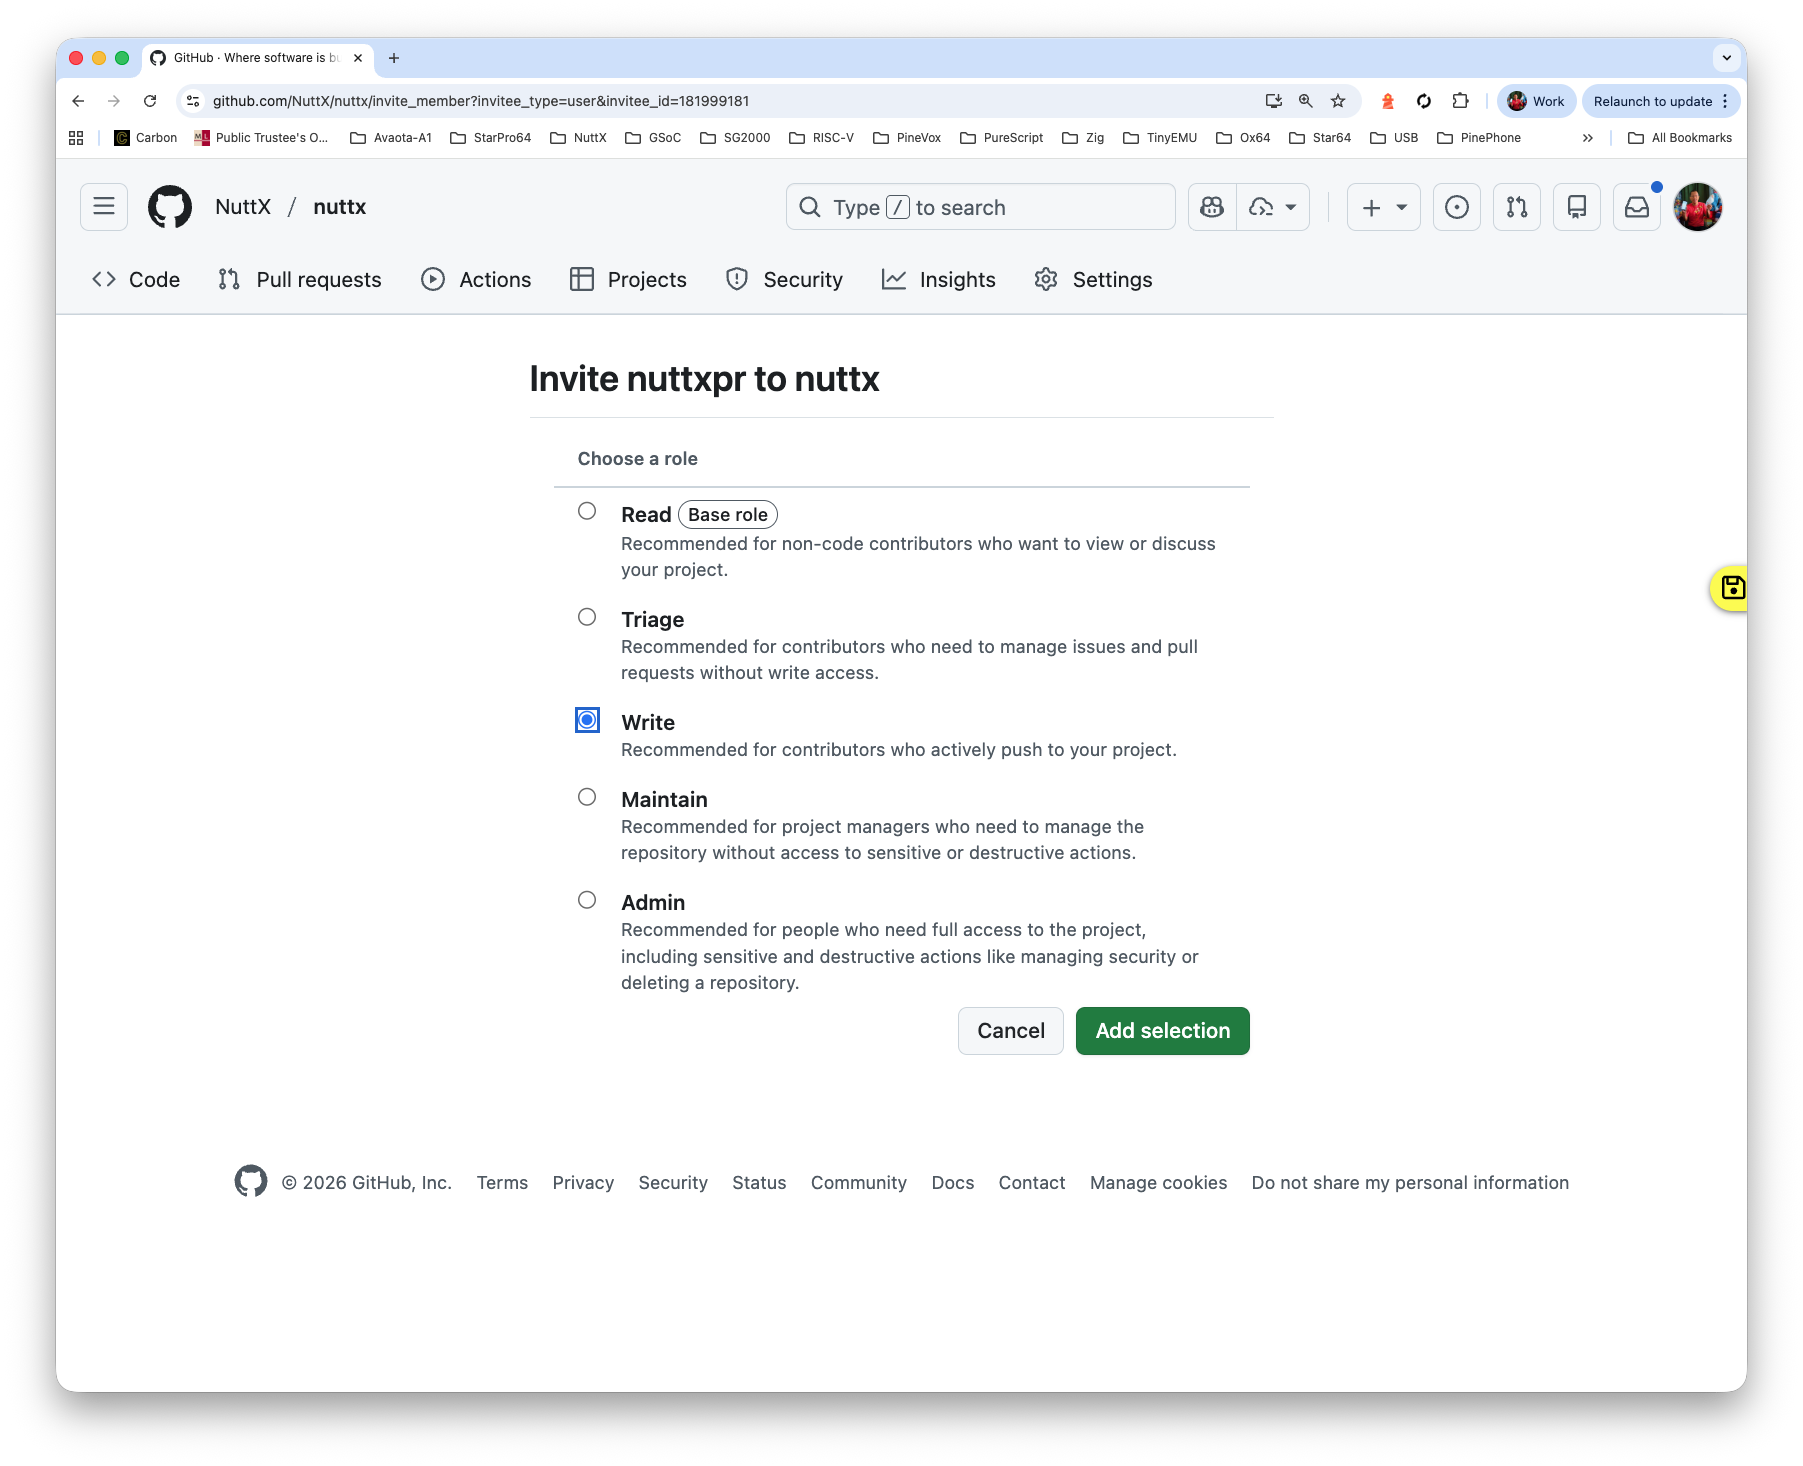
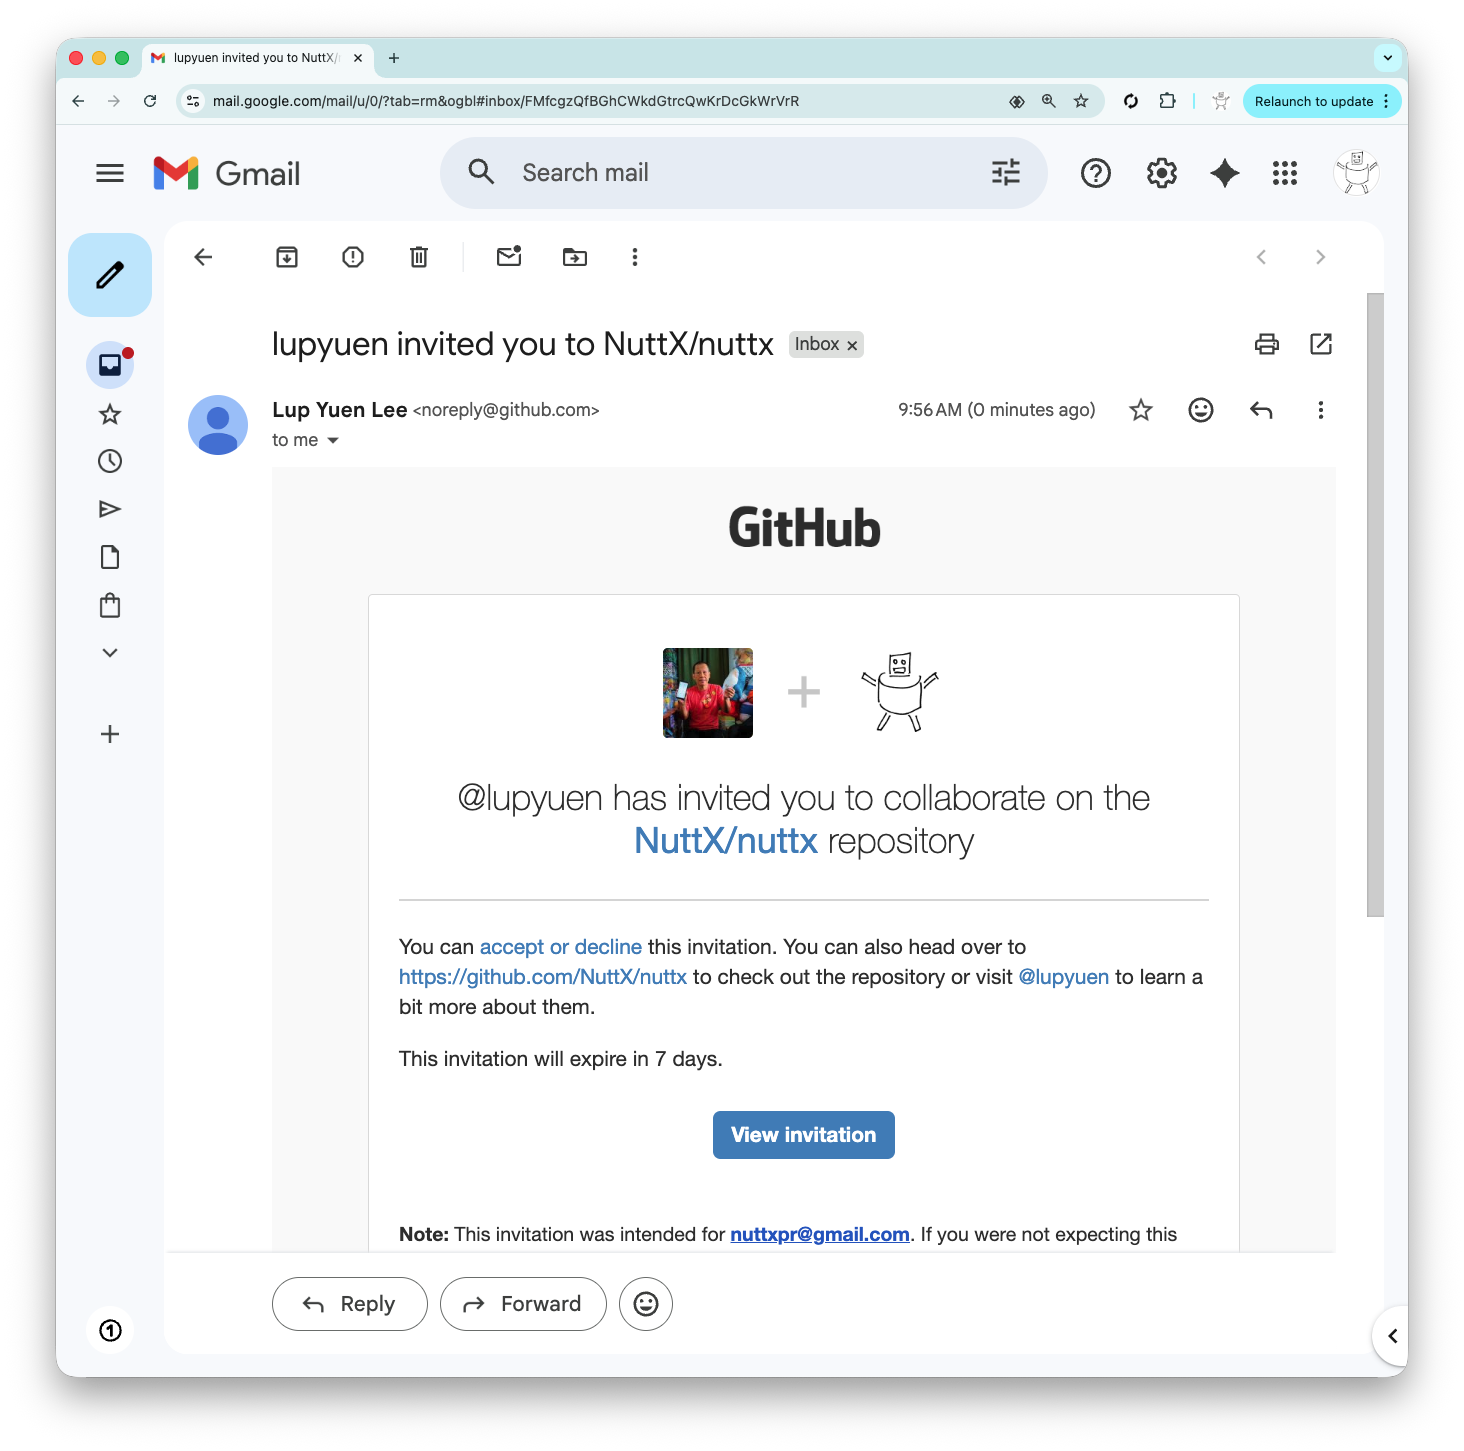
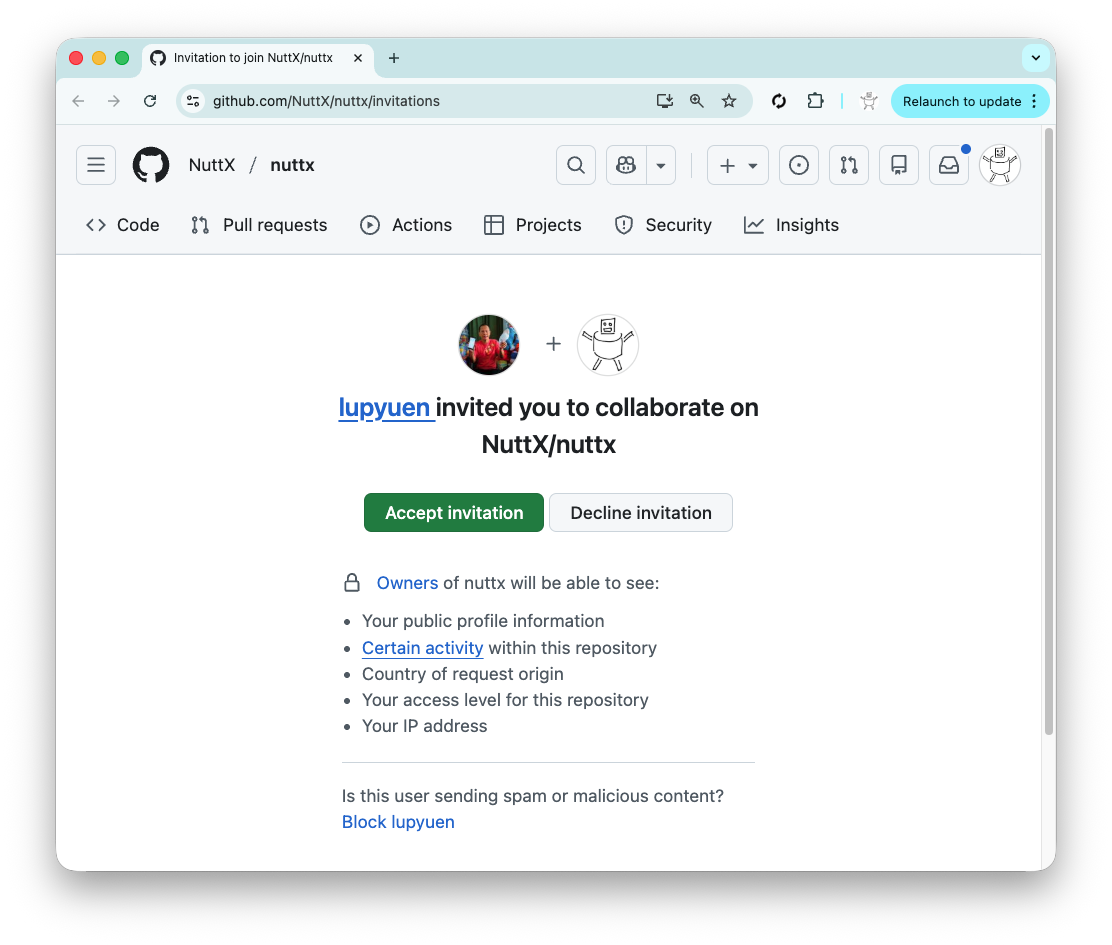
Log in as nuttxpr to accept the invitation
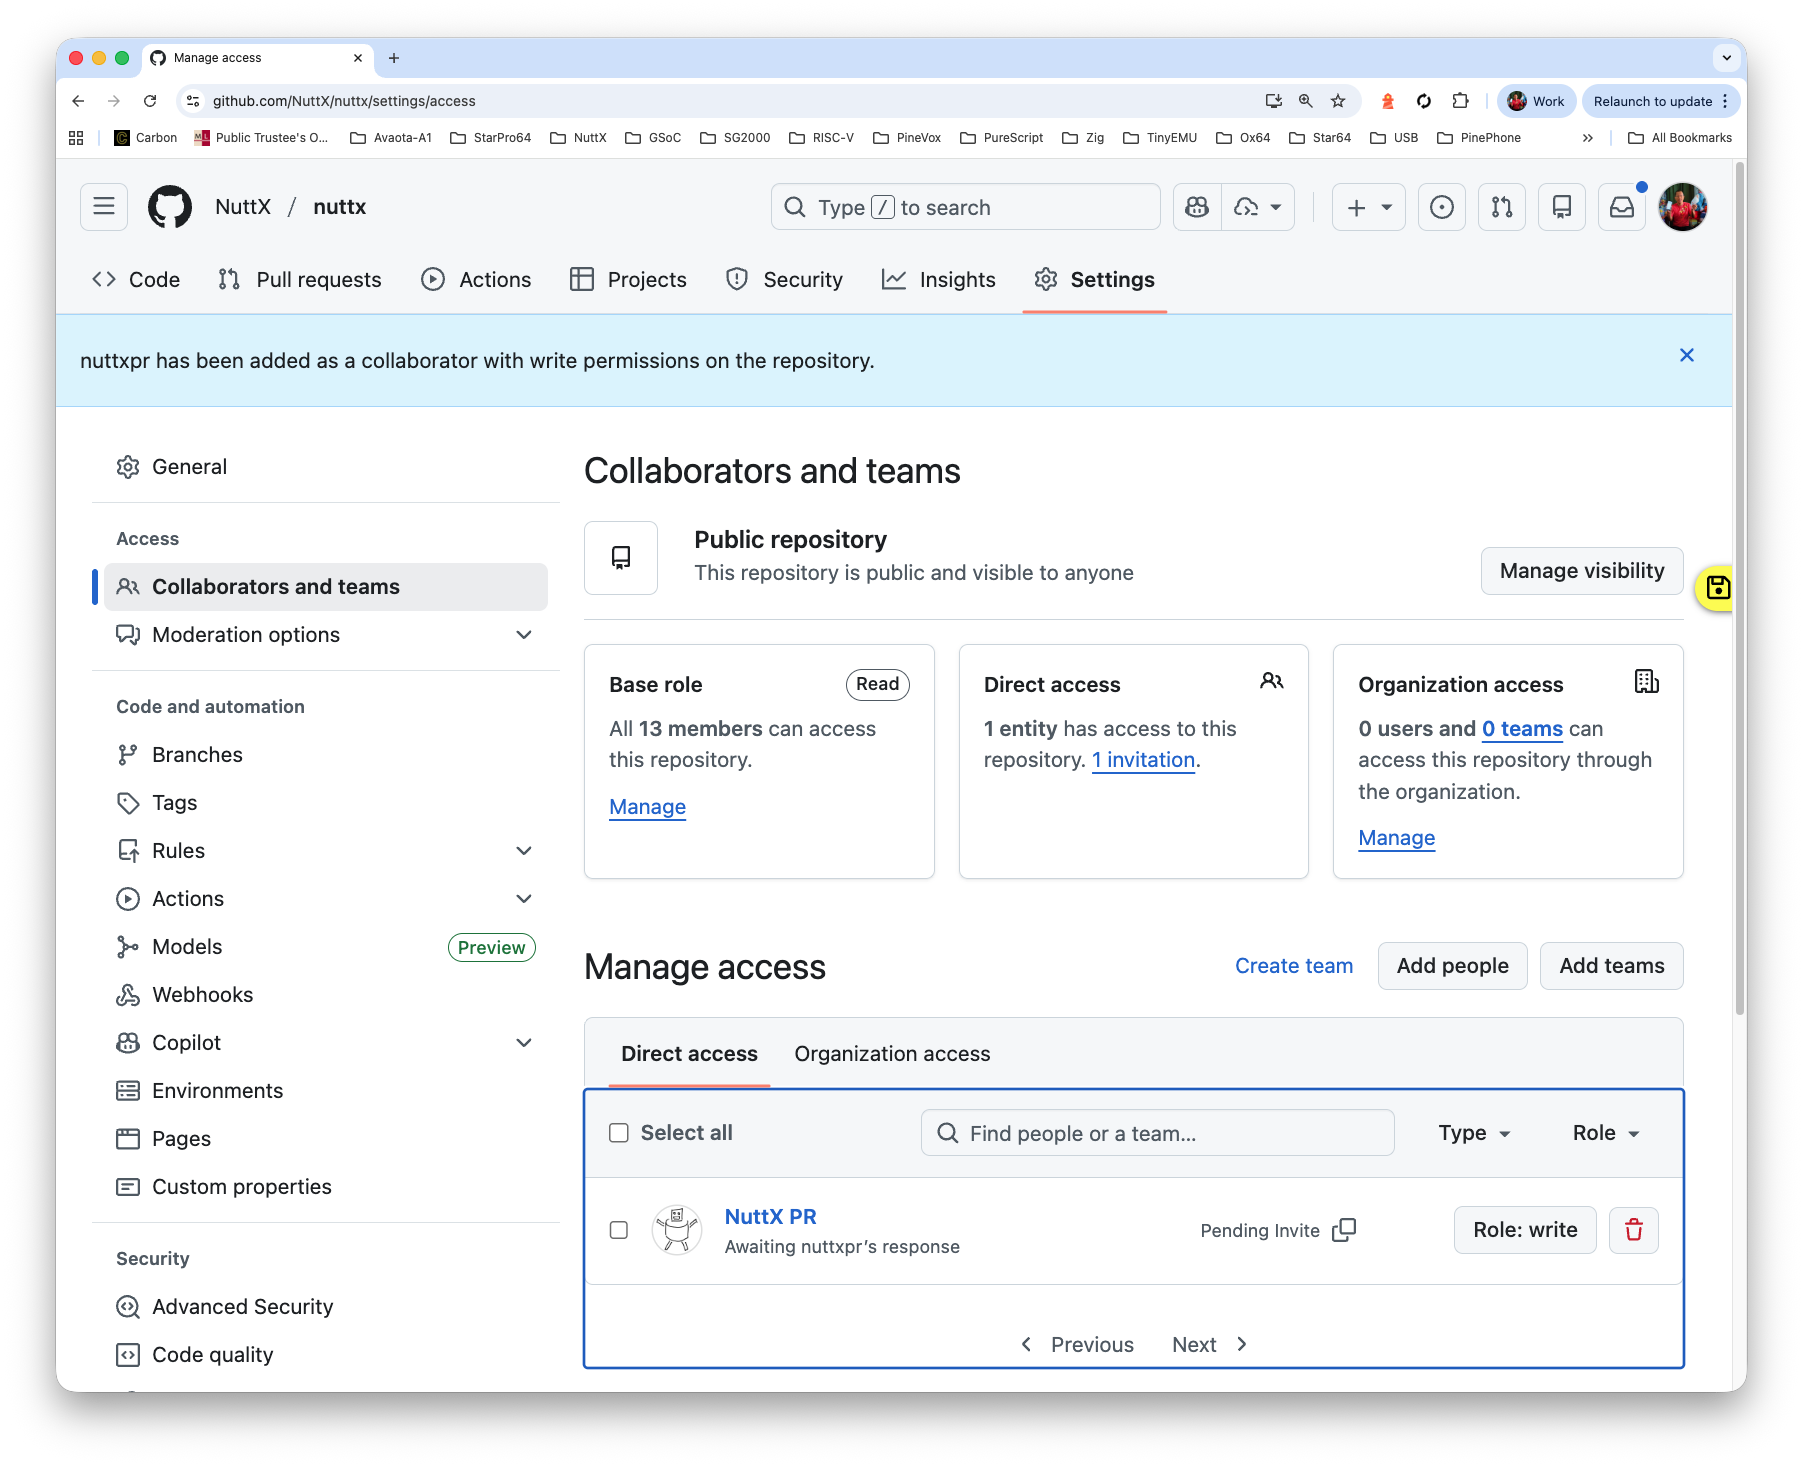
Check that nuttxpr has become a collaborator
https://github.com/NuttX/nuttx/settings/access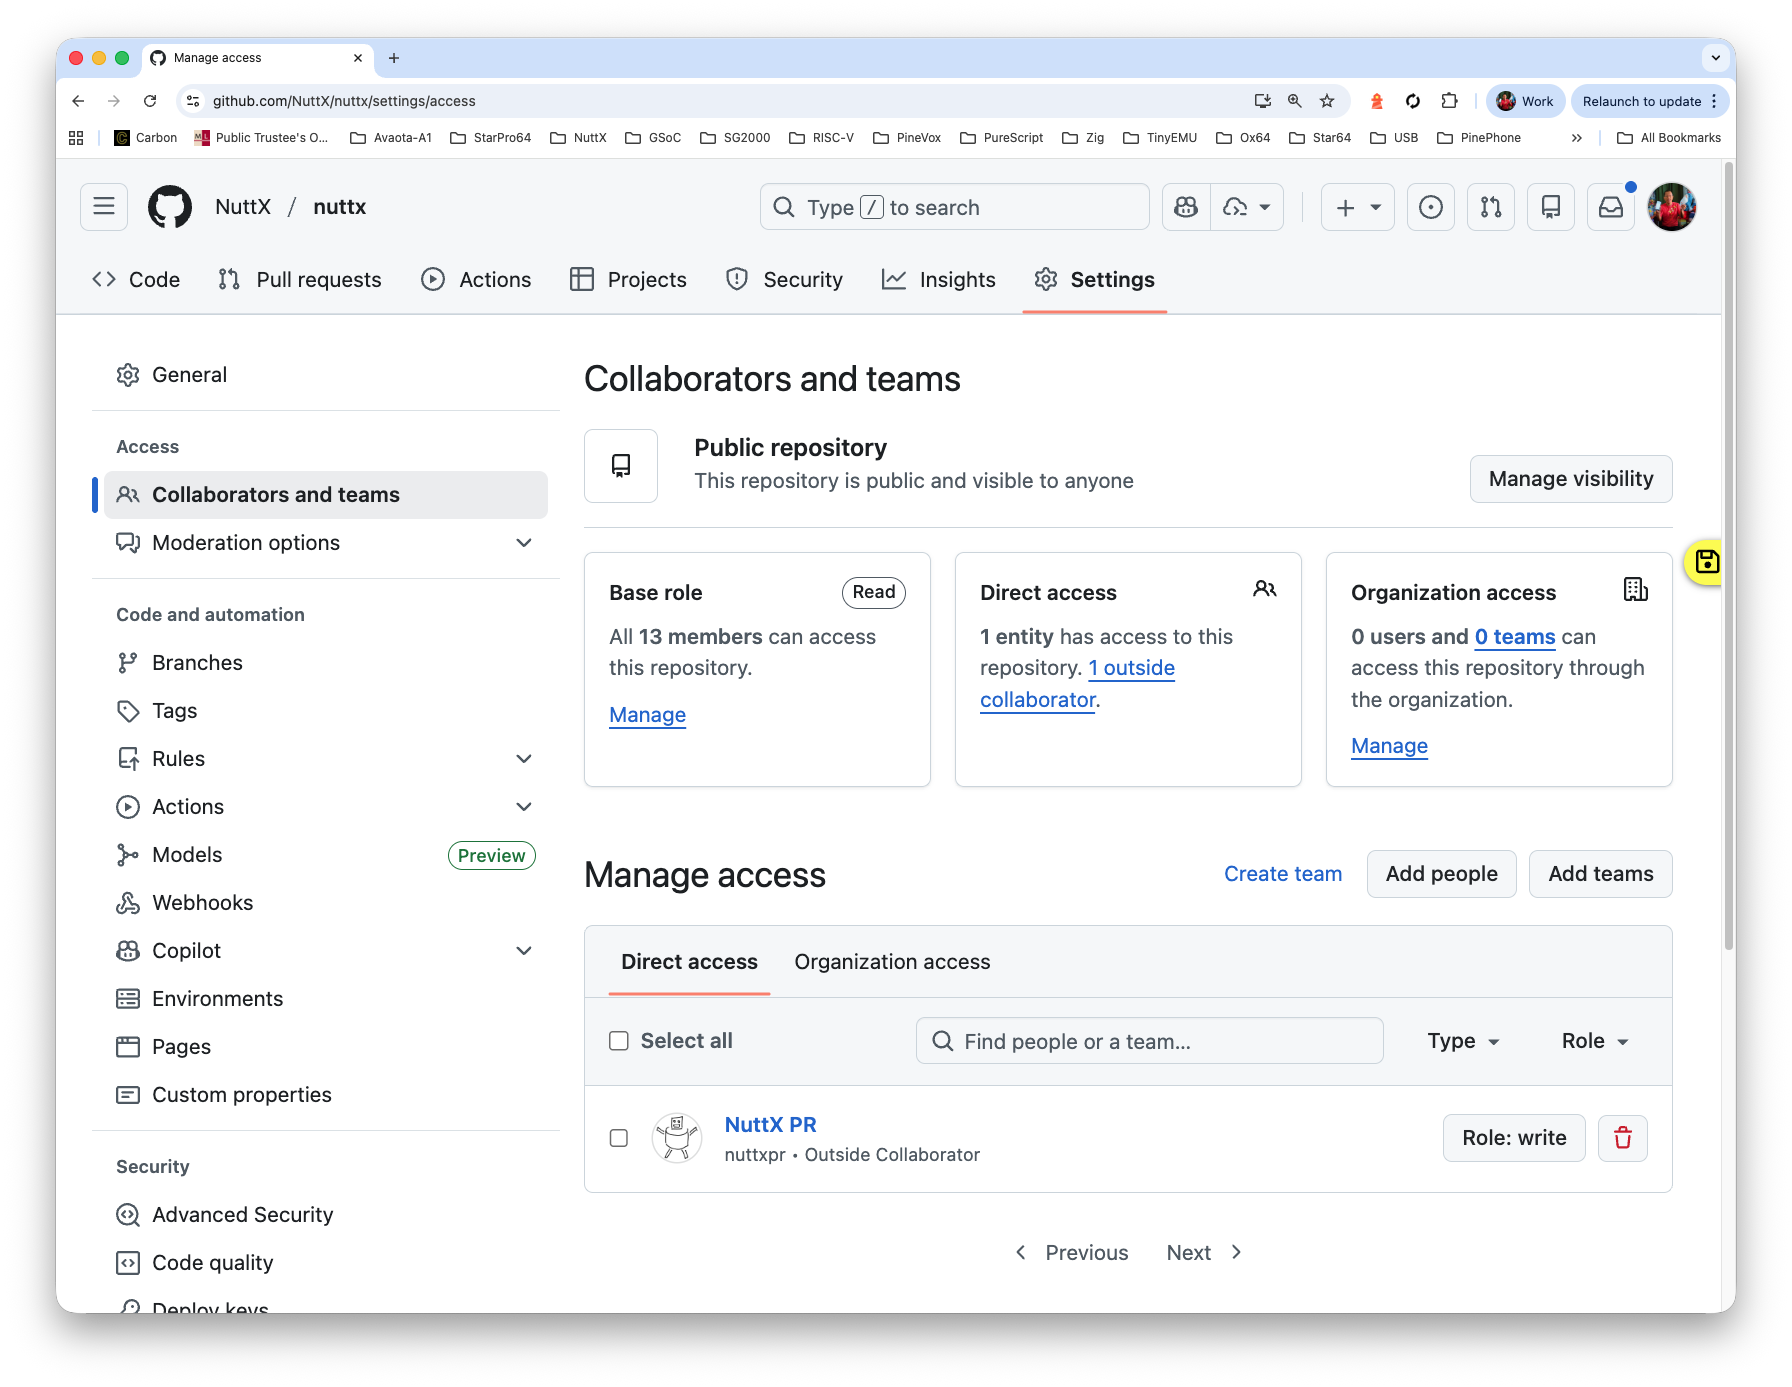
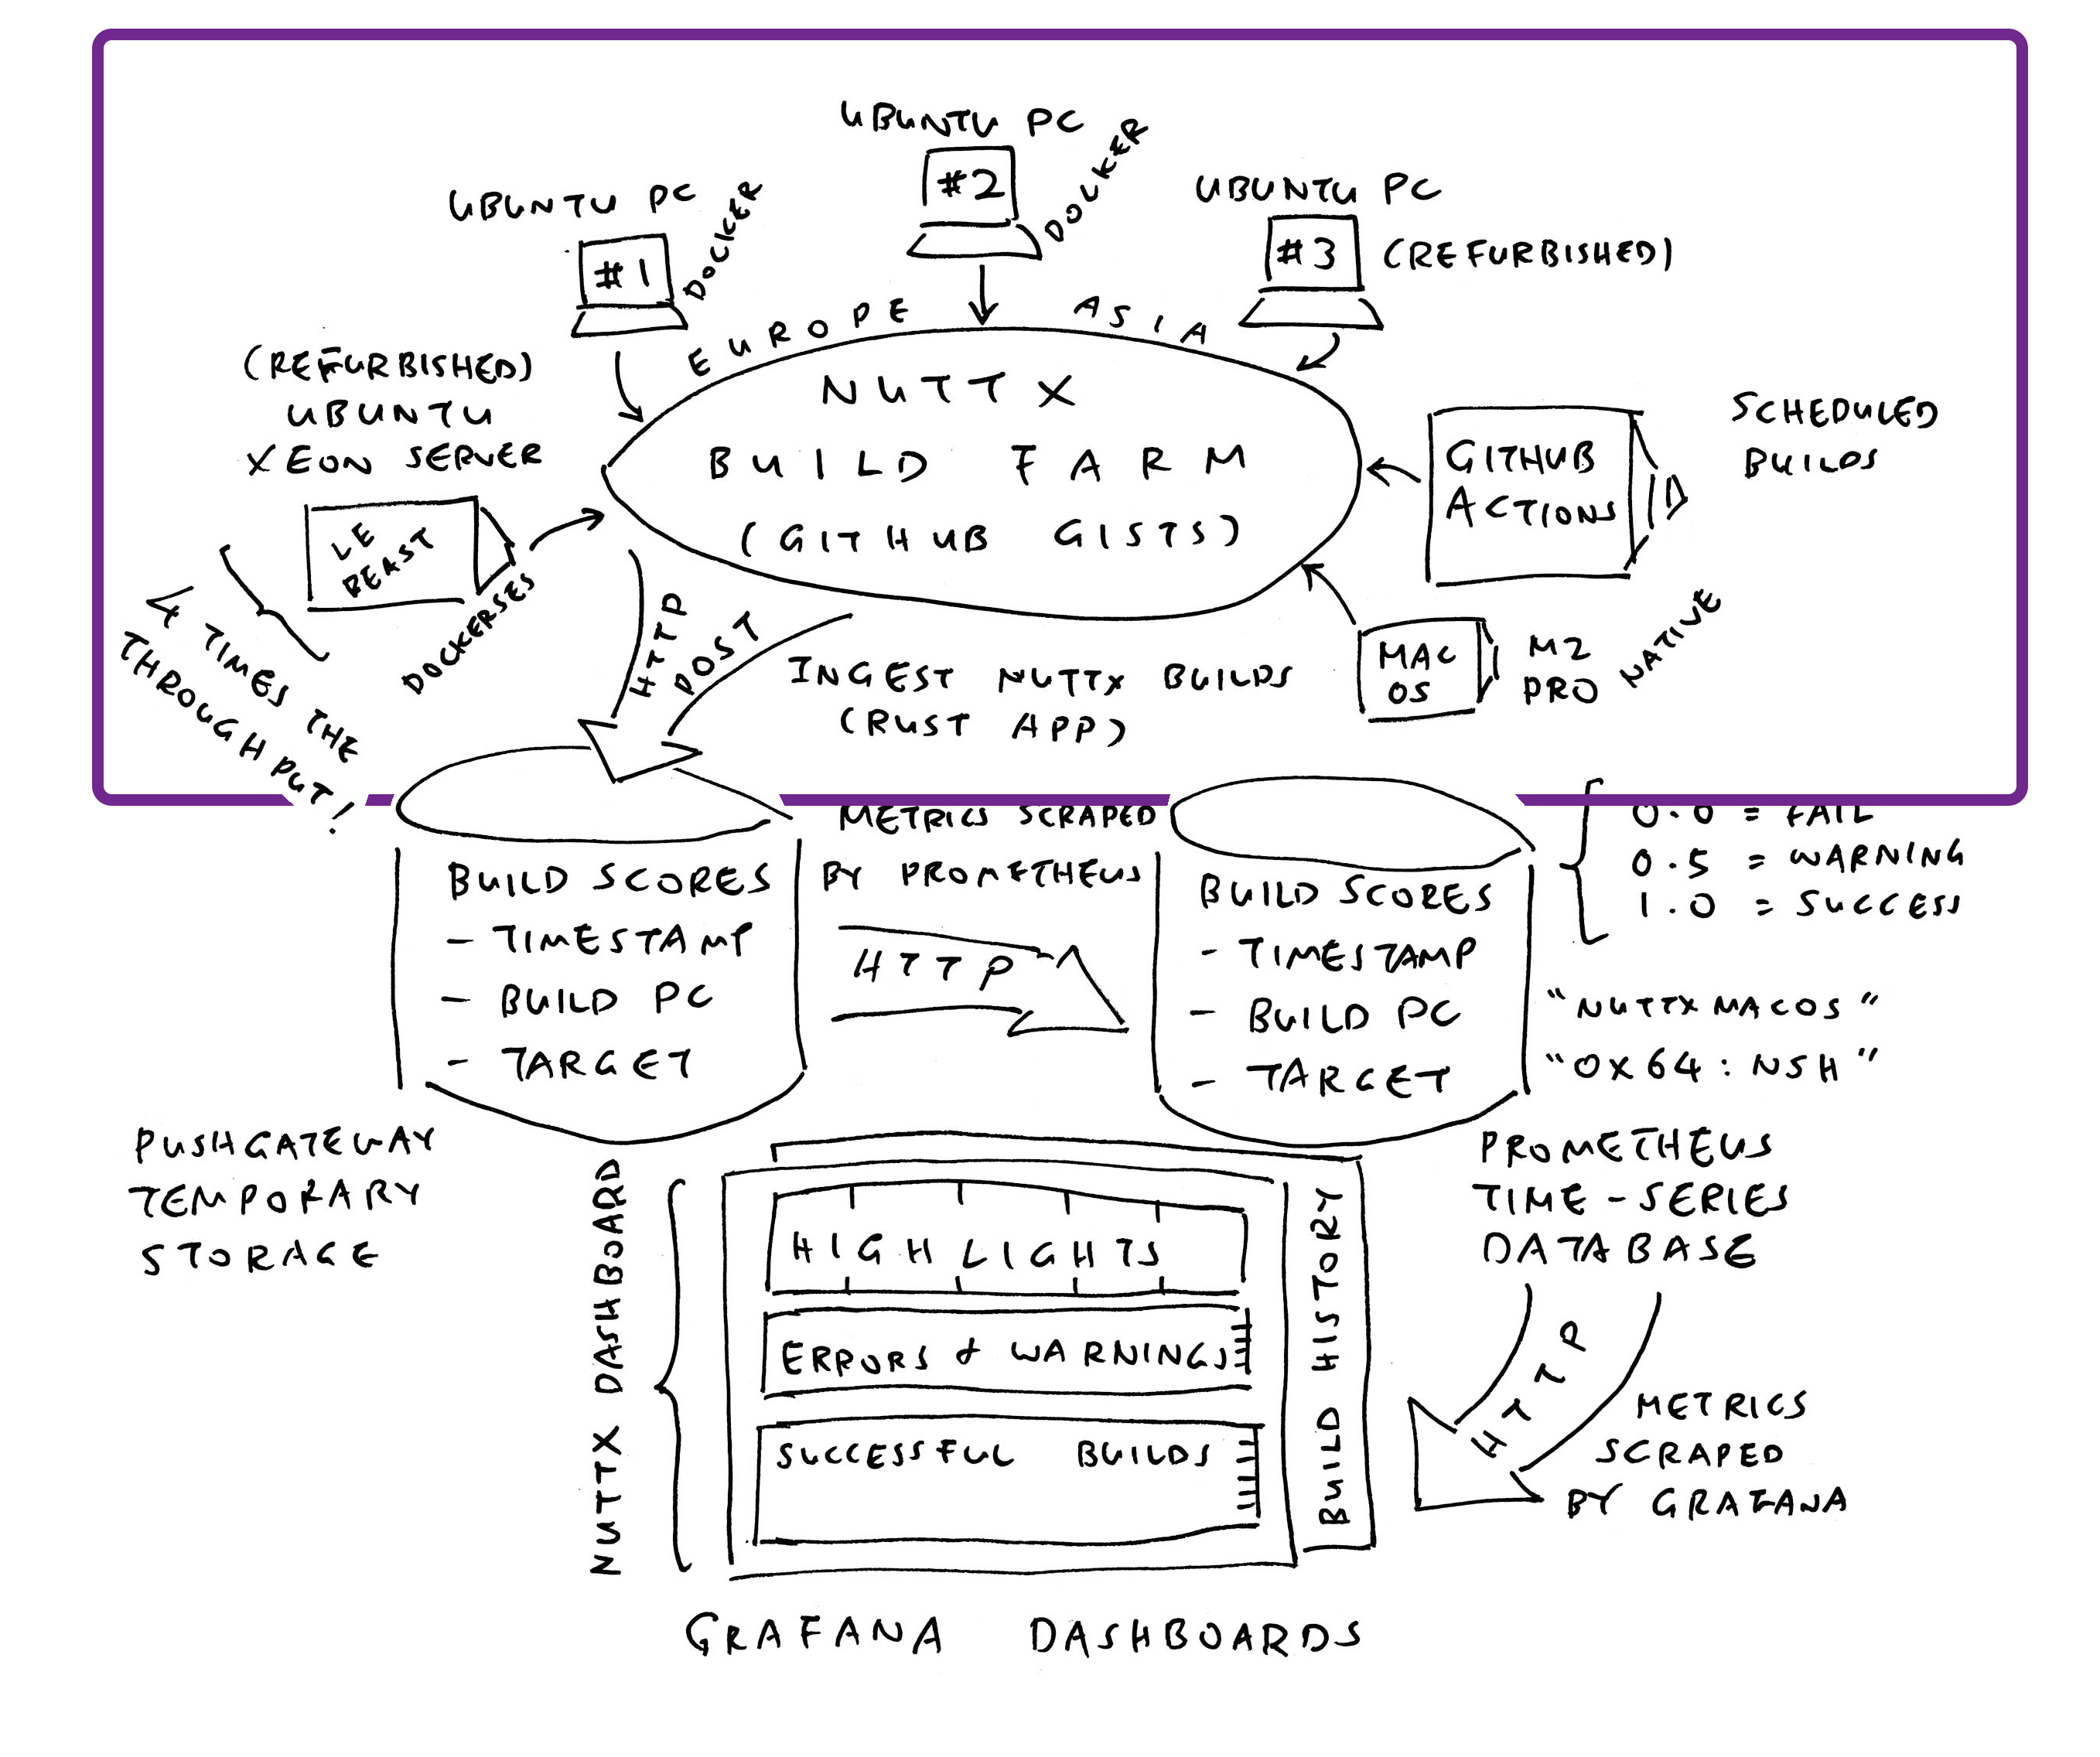
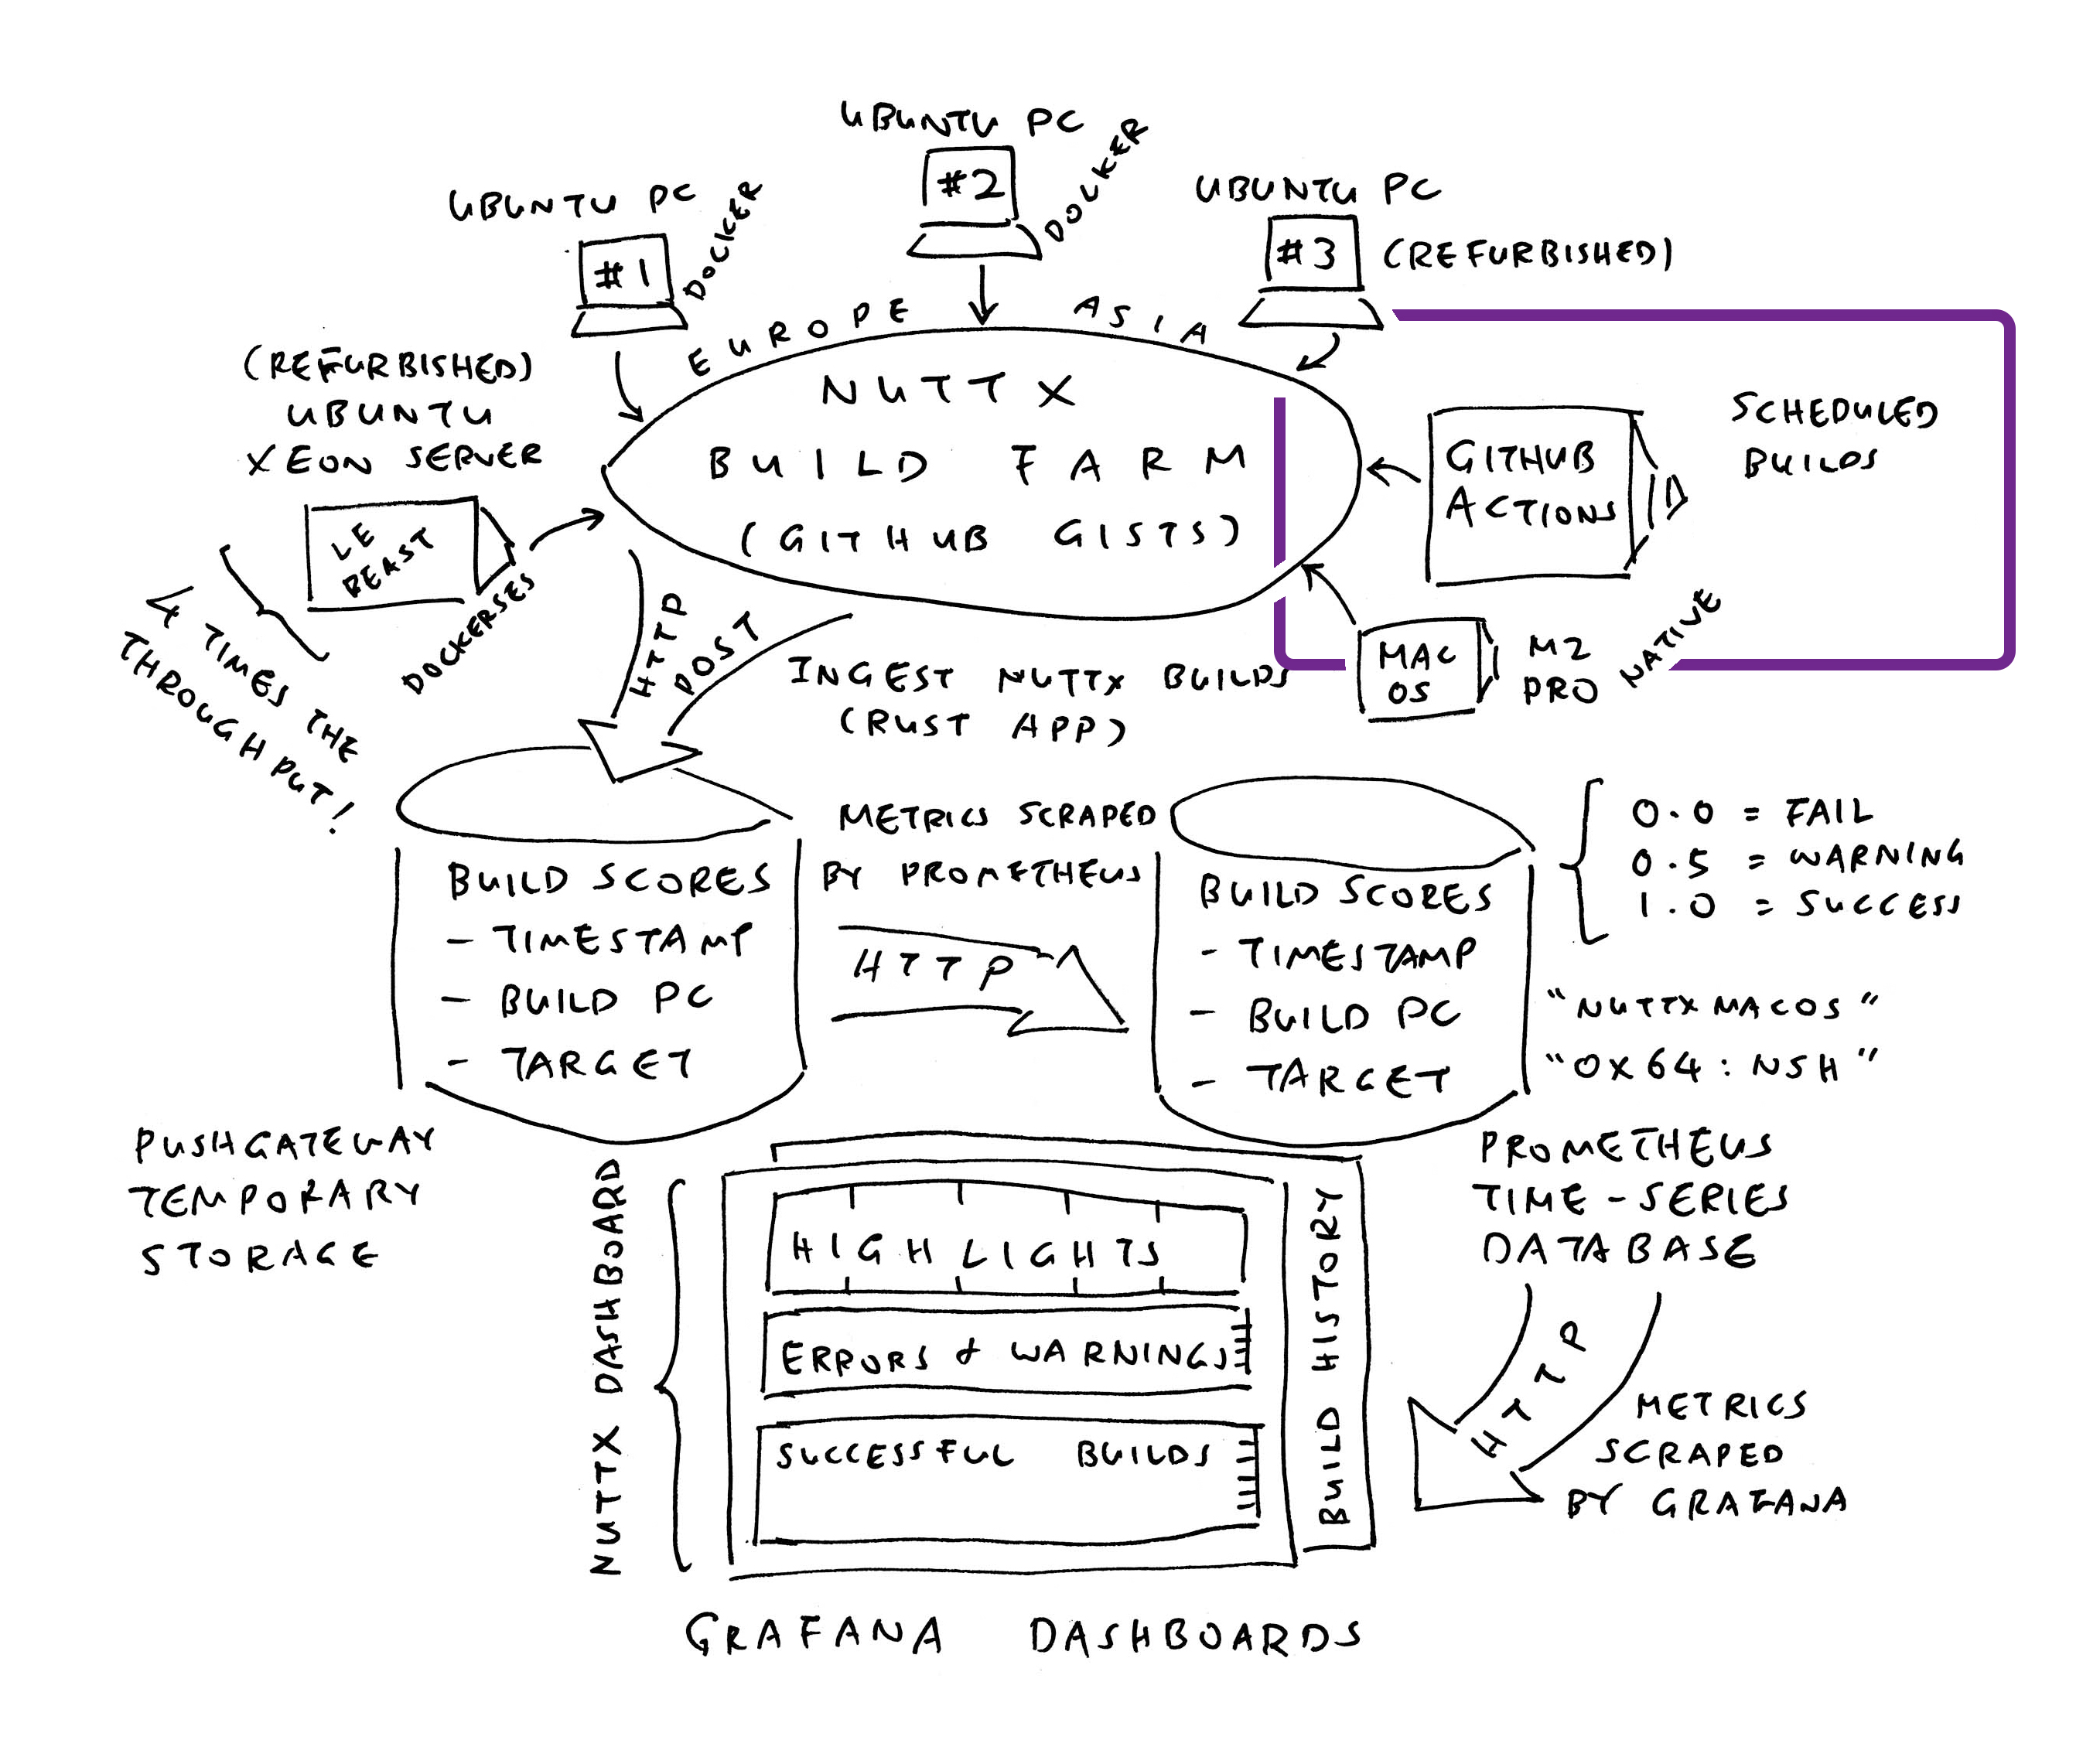
What’s with the GitHub Gists and GitLab Snippets?
We have a NuttX Build Farm hosted at home (pic above). Our Build Farm will build NuttX all day, and record the Build Logs into GitHub Gists or GitLab Snippets. We run the script below to ingest the Build Logs into NuttX Dashboard. (Remember to set GitLab Token)
Whenever our VM Boots: Do this…
## Ingest the GitHub Gists and GitLab Snippets
## https://github.com/lupyuen/ingest-nuttx-builds/blob/main/run.sh
tmux
cd $HOME/ingest-nuttx-builds
./run.sh

## If the SSH Session Disconnects:
## Do this to reconnect the run.sh session...
## tmux a

## Don't use cron, need to monitor manually so that we don't
## overuse the GitHub API and GitLab API
(Log for ingest-nuttx-builds/run.sh)
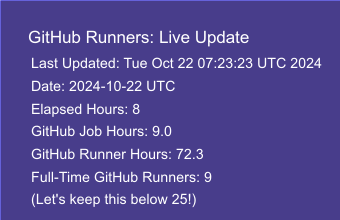
We have a job that computes the Live Metric for GitHub Runners (utilisation of GitHub Actions, pic above)
Whenever our VM Boots: Do this…
## Run the job inside tmux for easier monitoring
tmux

## Set the GitHub Token
. $HOME/github-token.sh
gh auth status

## We should see...
## ✓ Logged in to github.com account nuttxpr (GITHUB_TOKEN)
## - Active account: true
## - Git operations protocol: https
## - Token: ghp_************************************
## - Token scopes: 'read:org', 'repo'

## Remember to grant Write Access to nuttxpr for nuttx-metrics repo
## (Invite nuttxpr as Collaborator)
sudo apt install bc imagemagick
git clone [email protected]:lupyuen/nuttx-metrics.git
cd nuttx-metrics
./run2.sh
What triggers the Daily Build at NuttX Mirror Repo?
Our script sync-build-ingest.sh will trigger the Daily Build, followed by the ingestion of the GitHub Actions Logs.
Inside the script: Our Regular GitHub Account nuttxpr will start the build by pushing a patch to the NuttX Mirror Repo (pic above). This is how we create an SSH Key for GitHub that will allow nuttxpr to push the patch…
(nuttxpr is an Ordinary GitHub Account with Read Access. Don’t use a GitHub Admin Account!)
Inside our VM: Create the GitHub SSH Key
## From https://docs.github.com/en/authentication/connecting-to-github-with-ssh/generating-a-new-ssh-key-and-adding-it-to-the-ssh-agent
ssh-keygen \
  -t ed25519 \
  -f $HOME/.ssh/nuttxpr@github \
  -C "nuttxpr@github"
Add the SSH Key to GitHub Account
Copy from our Public Key at $HOME/.ssh/[email protected], paste into GitHub
Test the SSH Key
ssh -T \
  -i $HOME/.ssh/nuttxpr@github \
  [email protected]

## We should see...
## Hi nuttxpr! You've successfully authenticated, but GitHub does not provide shell access.
Add the SSH Key to our SSH Config. Edit $HOME/.ssh/config
nano $HOME/.ssh/configAdd this…
Host github.com
  IdentityFile ~/.ssh/nuttxpr@github
Test our updated SSH Config
## Should now work without stating Private Key
ssh -T \
  [email protected]

## We should see...
## Hi nuttxpr! You've successfully authenticated, but GitHub does not provide shell access.Connecting to our VM gets tedious. Let’s create an SSH Key for VM Login…
Create the SSH Key on Our Computer (NOT the VM)
## From https://docs.cloud.google.com/compute/docs/connect/create-ssh-keys
## Do this on our computer, NOT the VM!
## Change "luppy" to your VM Username
ssh-keygen \
  -t rsa \
  -f $HOME/.ssh/nuttx-dashboard-vm \
  -C luppy

## Check the output
ls $HOME/.ssh/nuttx-dashboard-vm*

## We should see...
## nuttx-dashboard-vm
## nuttx-dashboard-vm.pub
Add the SSH Public Key to our VM…
Browse to “Google Cloud Console > Metadata”
https://console.cloud.google.com/compute/metadata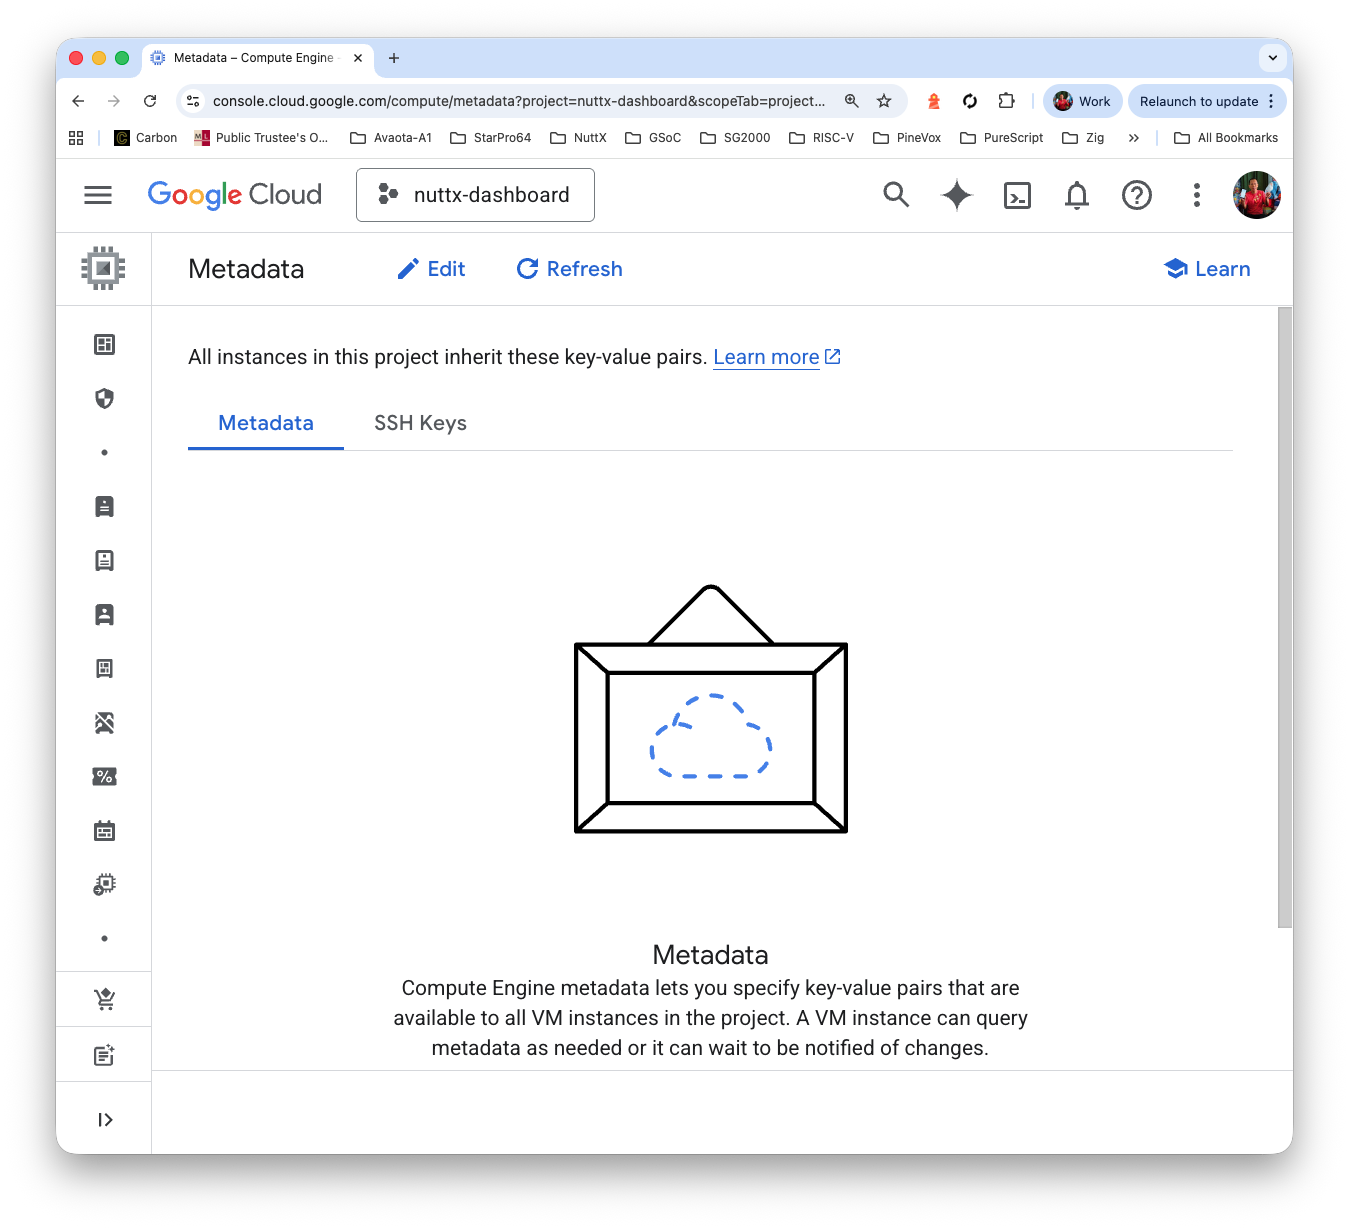
Click “SSH Keys > Add SSH Key”
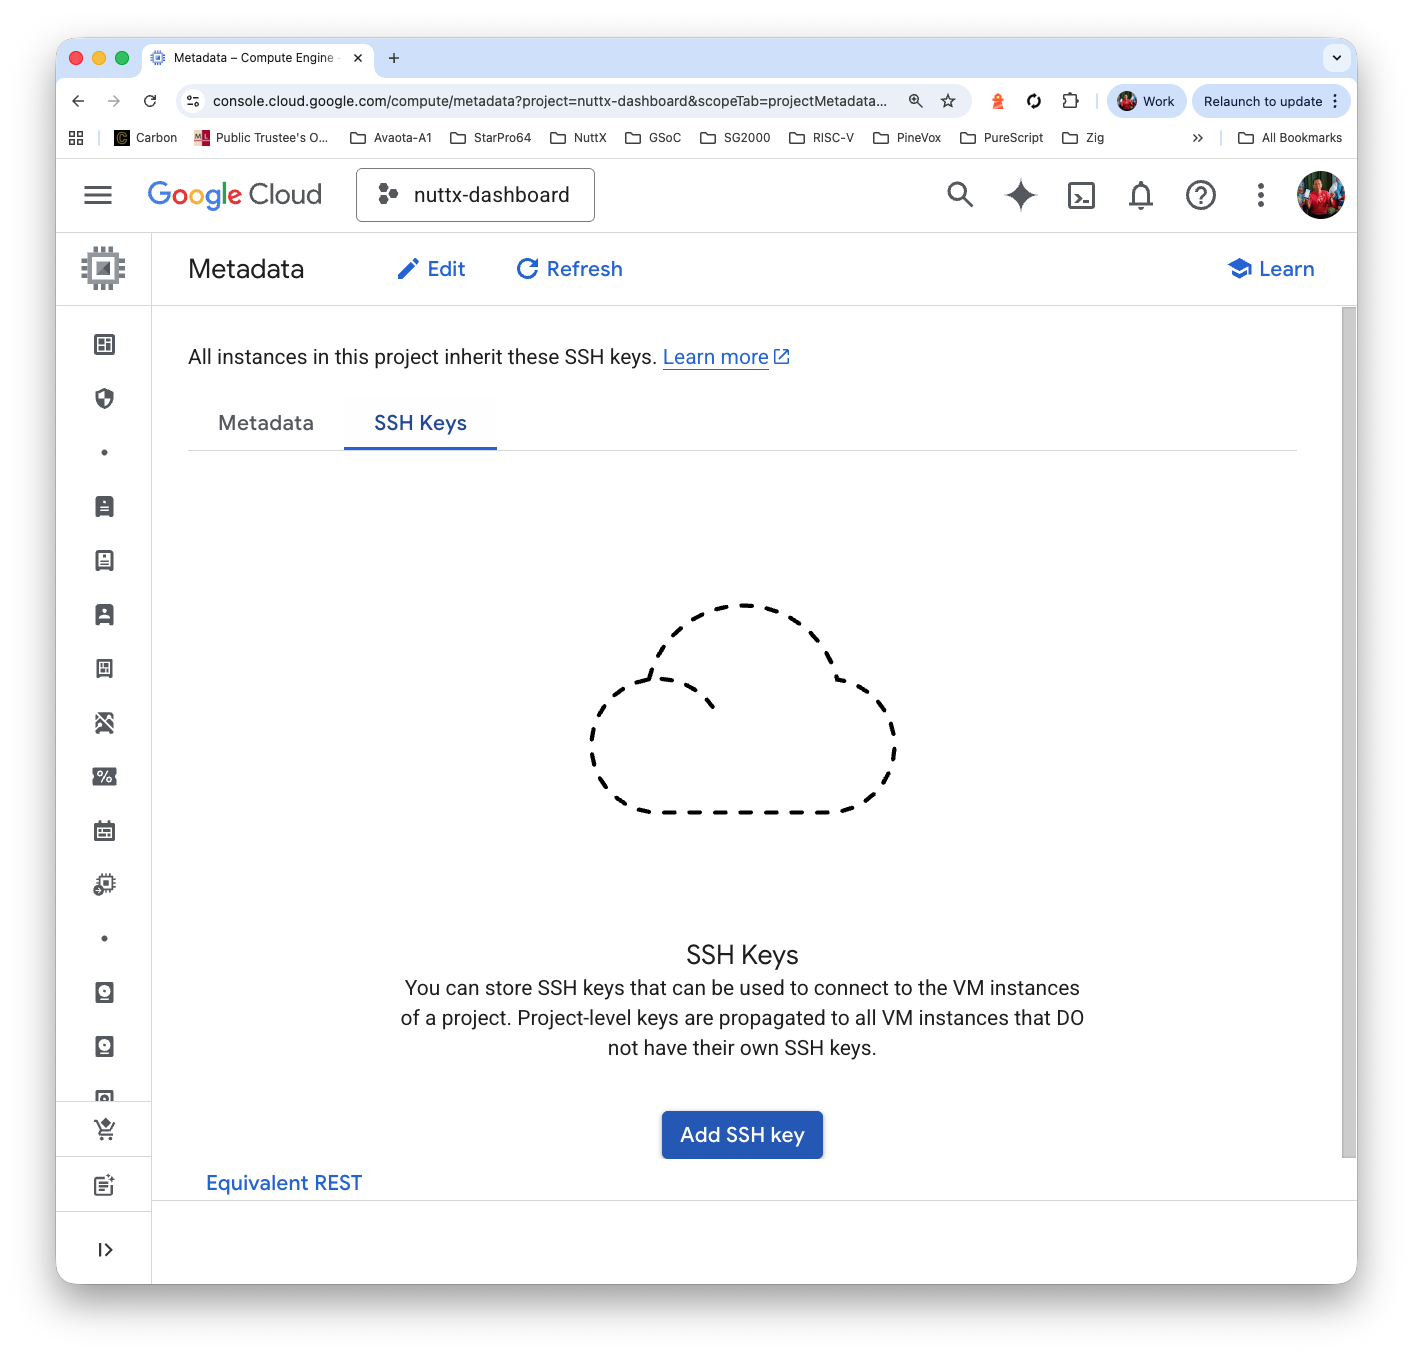
Copy and paste the contents of our Public Key: $HOME/.ssh/nuttx-dashboard-vm.pub
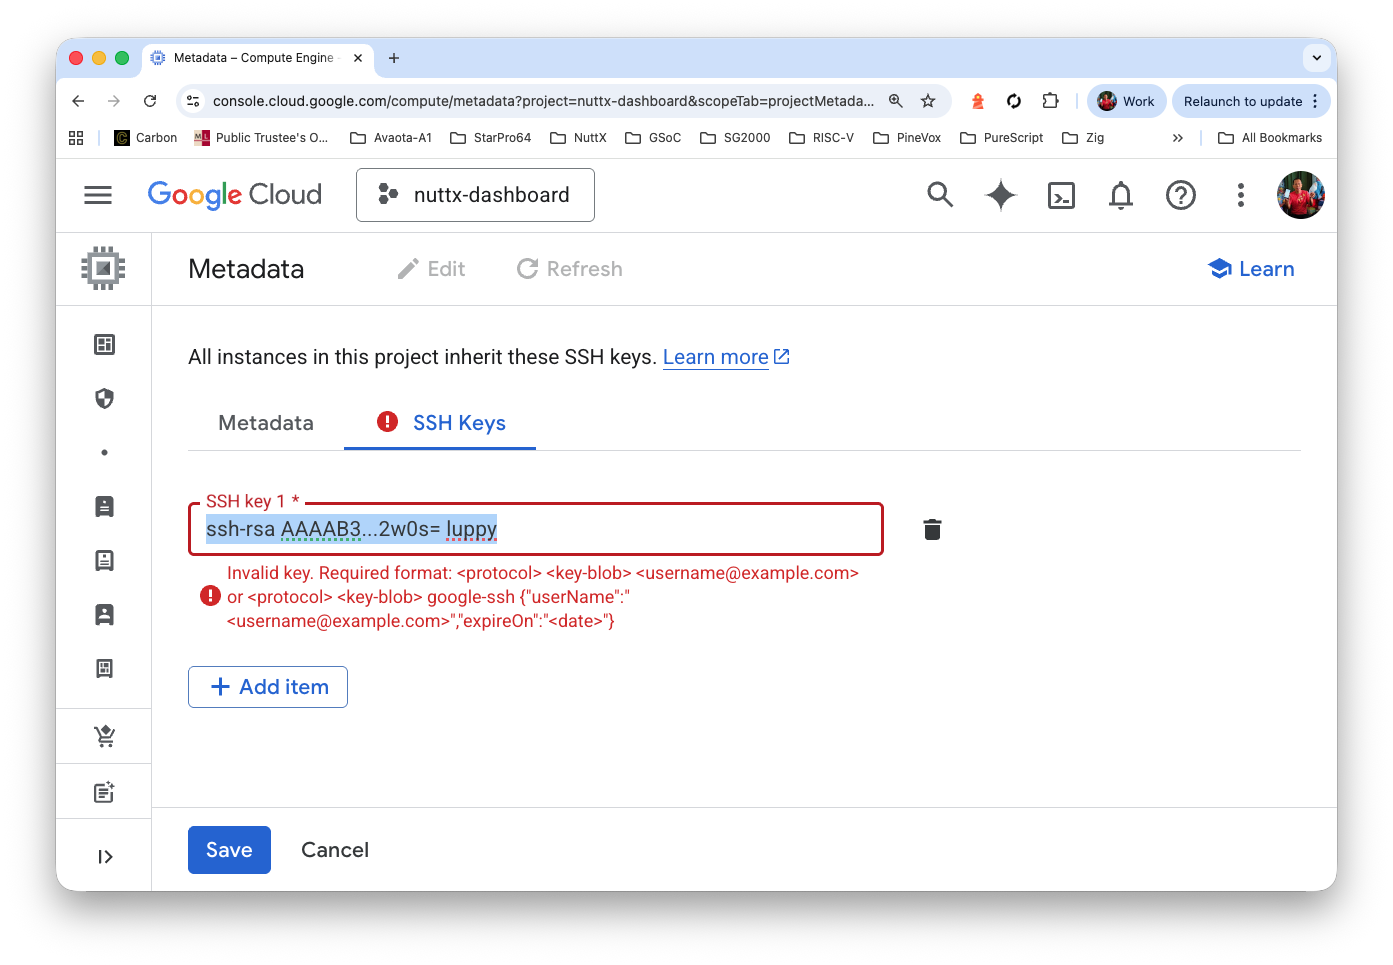
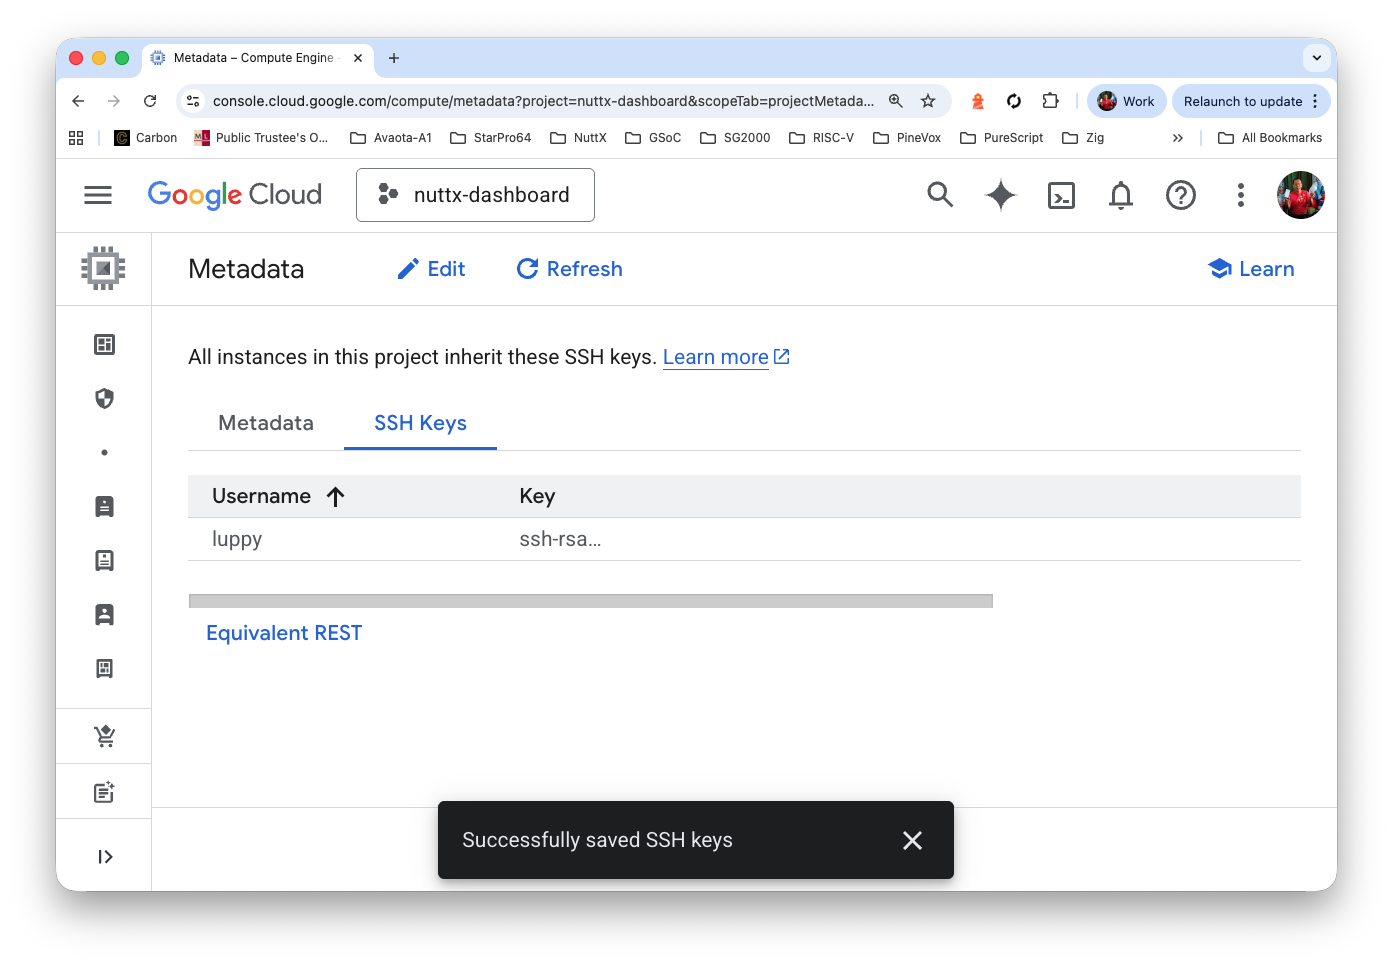
Click “Save”
Test the SSH Key with VM Login
## From https://docs.cloud.google.com/compute/docs/connect/standard-ssh#openssh-client
## Change "luppy" to your VM Username
ssh \
  -i $HOME/.ssh/nuttx-dashboard-vm \
[email protected]Is there an easier way to work with our VM?
Yep use a SSH Remote Connection in VSCode!
Assume that we have added an SSH Key for VM Login…
In VSCode: Click “Remote Explorer > SSH > +”
Enter the SSH Command…
ssh -i ~/.ssh/nuttx-dashboard-vm [email protected] 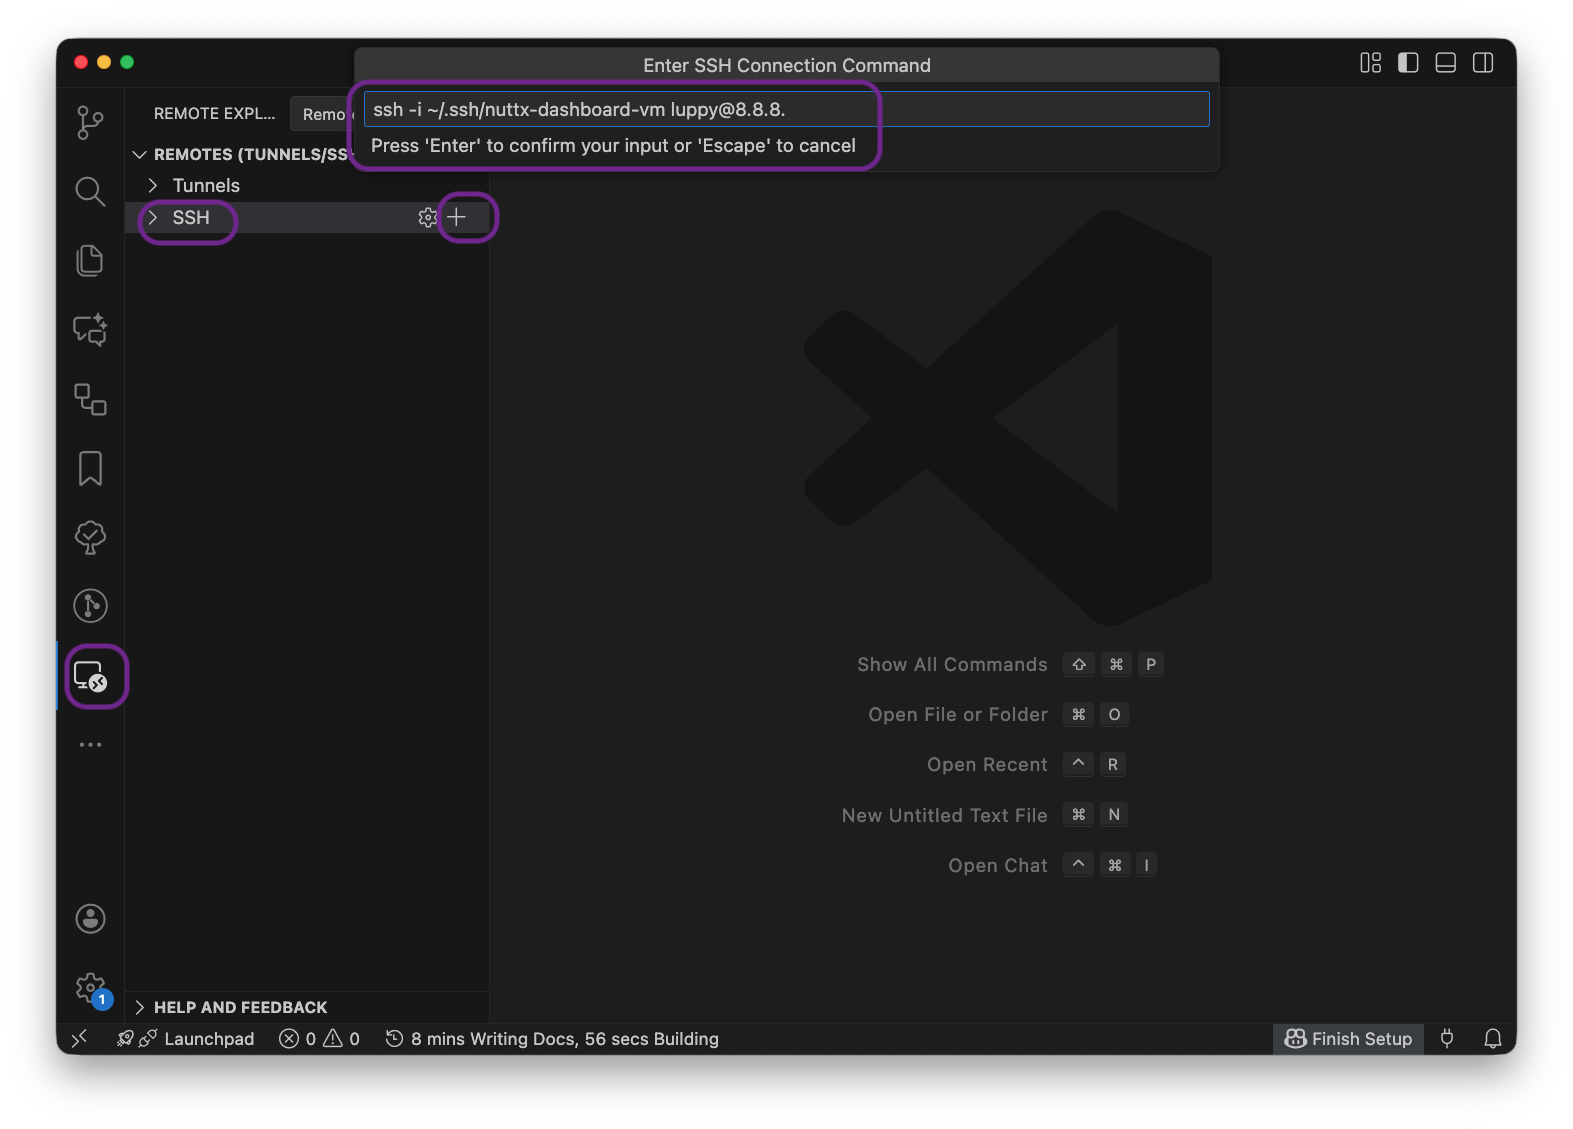
Select the SSH Config file $HOME/.ssh/config
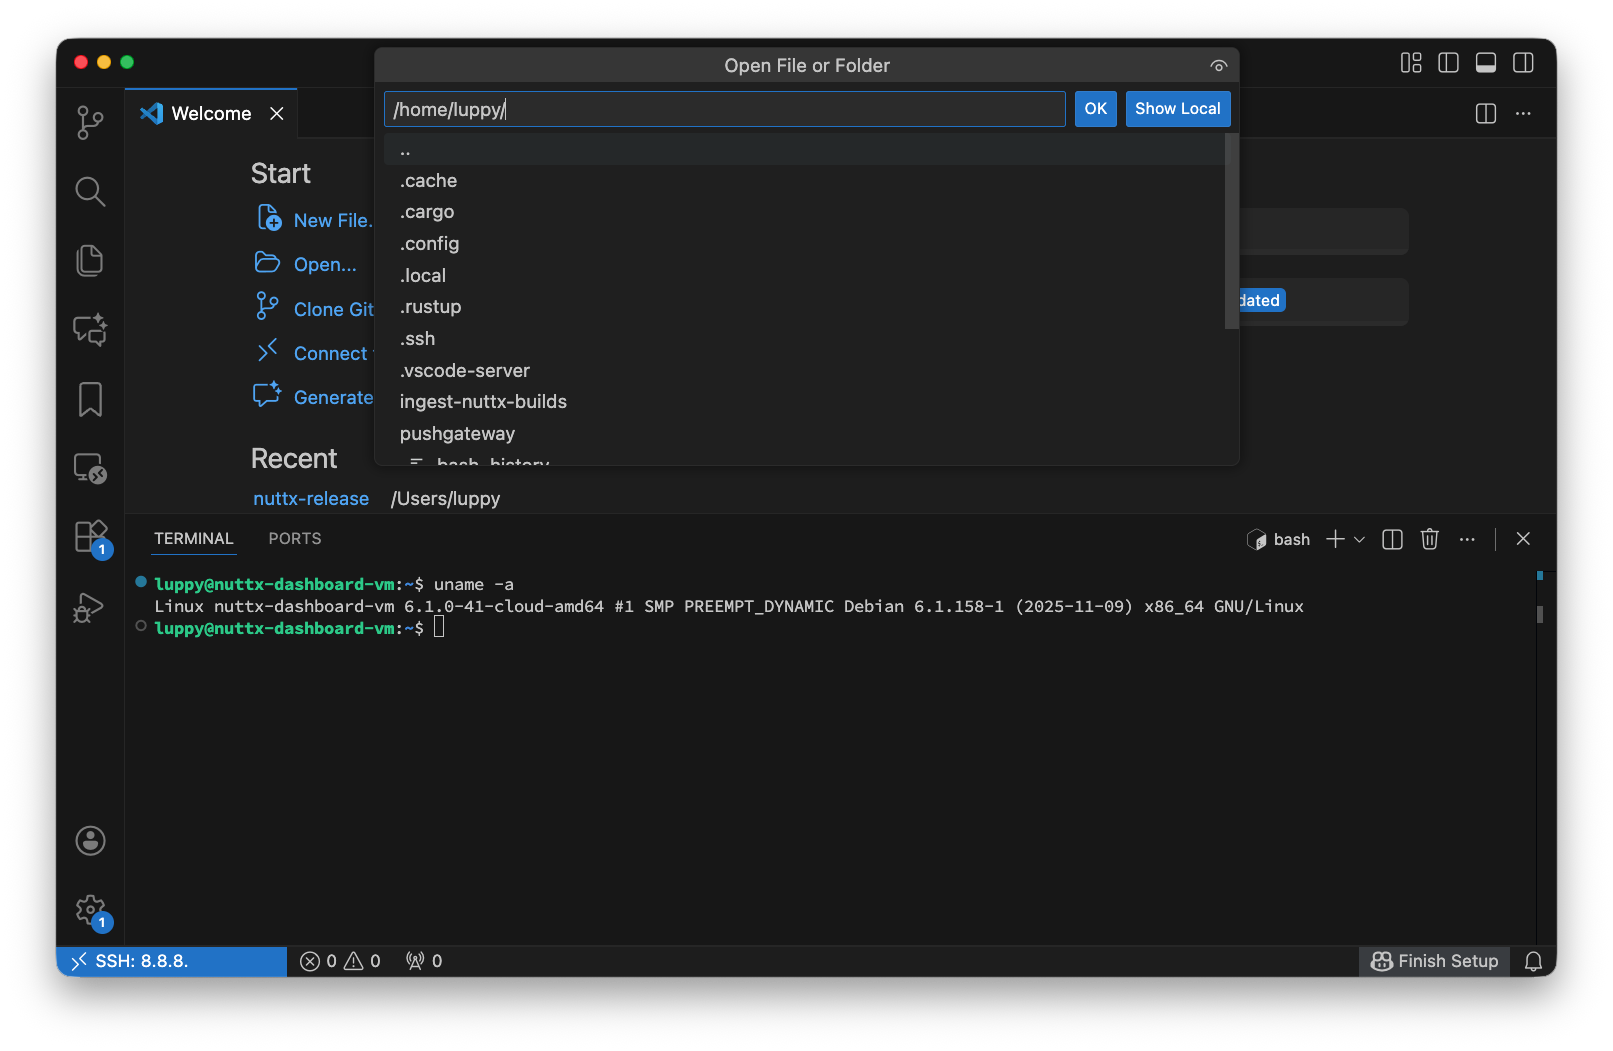
Click “Connect”
To open a Remote File or Remote Folder: Click “File > Open File / Folder”
$HOME/.ssh/config will look like:
Host x.x.x.x
  HostName x.x.x.x
  IdentityFile ~/.ssh/nuttx-dashboard-vm
  User luppy
Probably better to rename the “Host”, in case the IP Address changes…
Host nuttx-dashboard-vm
  HostName x.x.x.x
  IdentityFile ~/.ssh/nuttx-dashboard-vm
  User luppy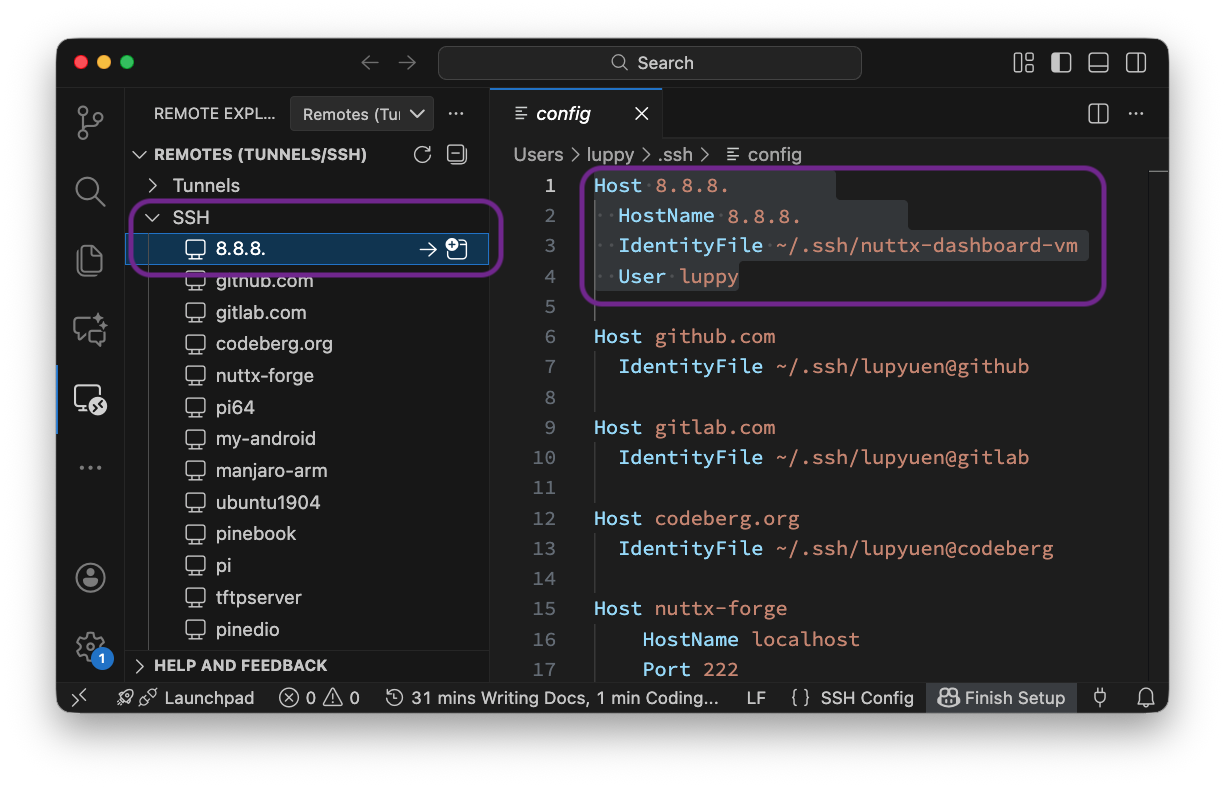
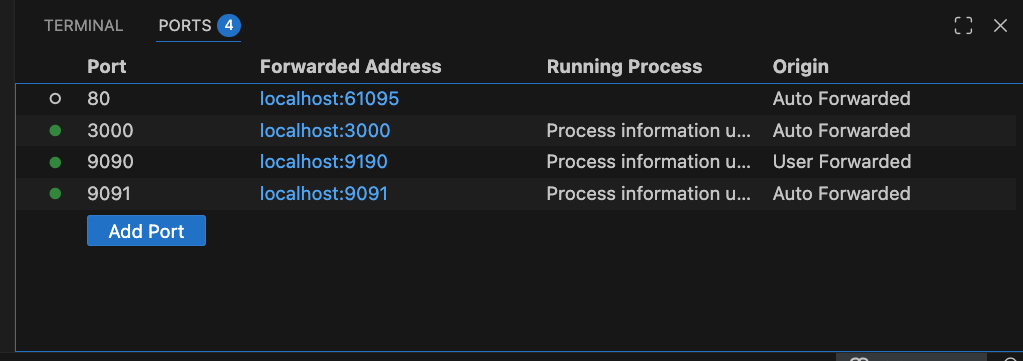
Port Forwarding over SSH works great with VSCode. Thus we can redirect the TCP Ports from the VM to Our Computer. And disable all the Firewall Rules!
By Default: Google Cloud allocates 10 GB of Disk Space…
$ df -H
Filesystem      Size  Used Avail Use% Mounted on
udev            2.1G     0  2.1G   0% /dev
tmpfs           412M  574k  411M   1% /run
/dev/sda1        11G  8.5G  1.4G  87% /
tmpfs           2.1G     0  2.1G   0% /dev/shm
tmpfs           5.3M     0  5.3M   0% /run/lock
/dev/sda15      130M   13M  118M  10% /boot/efi
tmpfs           412M     0  412M   0% /run/user/1000
But /tmp and /dev/sda1 will Run Out of Disk Space while ingesting NuttX Build Logs…
## Out of space in /tmp
$ df -H
Filesystem      Size  Used Avail Use% Mounted on
udev            2.1G     0  2.1G   0% /dev
tmpfs           412M  574k  411M   1% /run
/dev/sda1        11G  9.8G     0 100% /
tmpfs           2.1G     0  2.1G   0% /dev/shm
tmpfs           5.3M     0  5.3M   0% /run/lock
/dev/sda15      130M   13M  118M  10% /boot/efi
tmpfs           412M     0  412M   0% /run/user/1000

## Most of the disk space used by /tmp
$ rm -rf /tmp/sync-build-ingest/
This is how we Expand the VM Disk, from 10 GB to 80 GB…
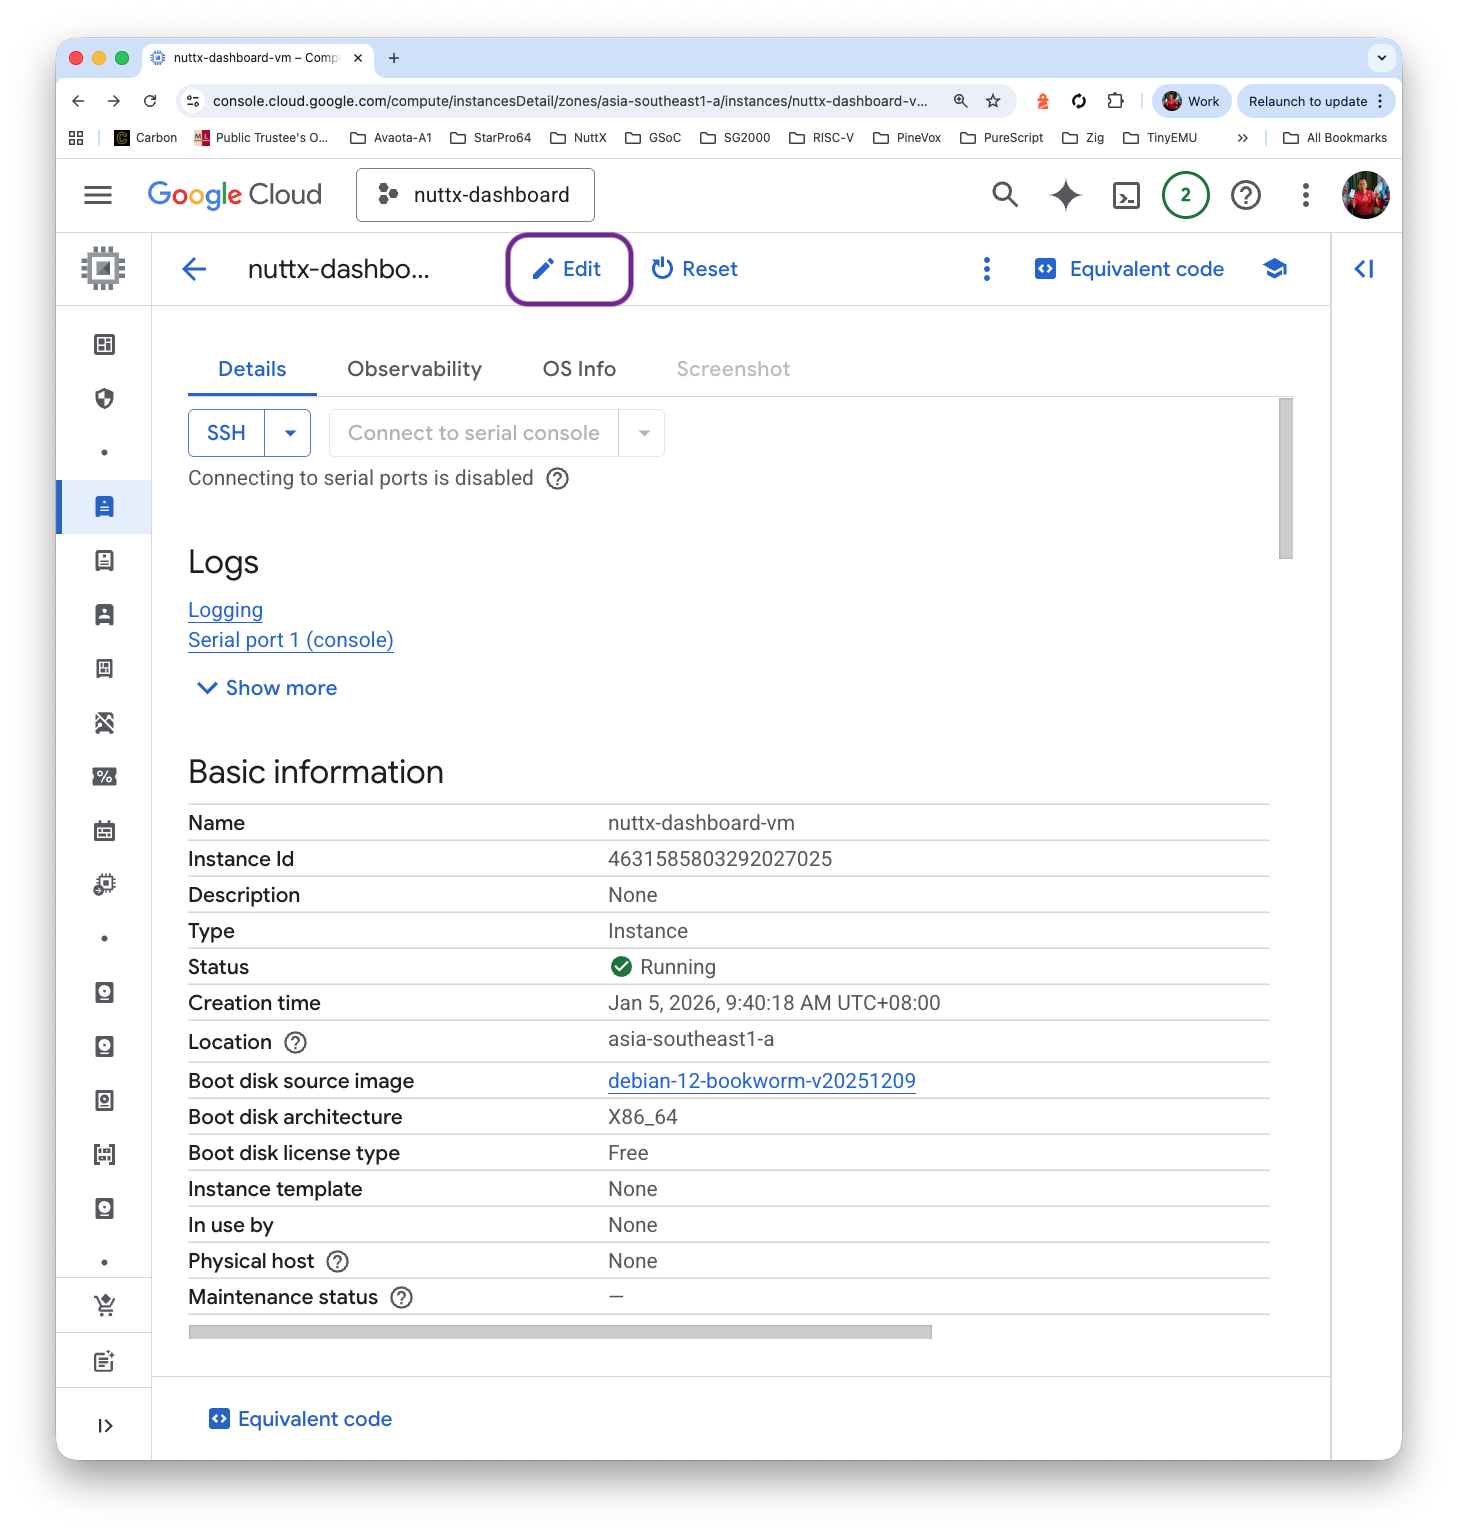
Click “VM > Details > Storage > Boot Disk”
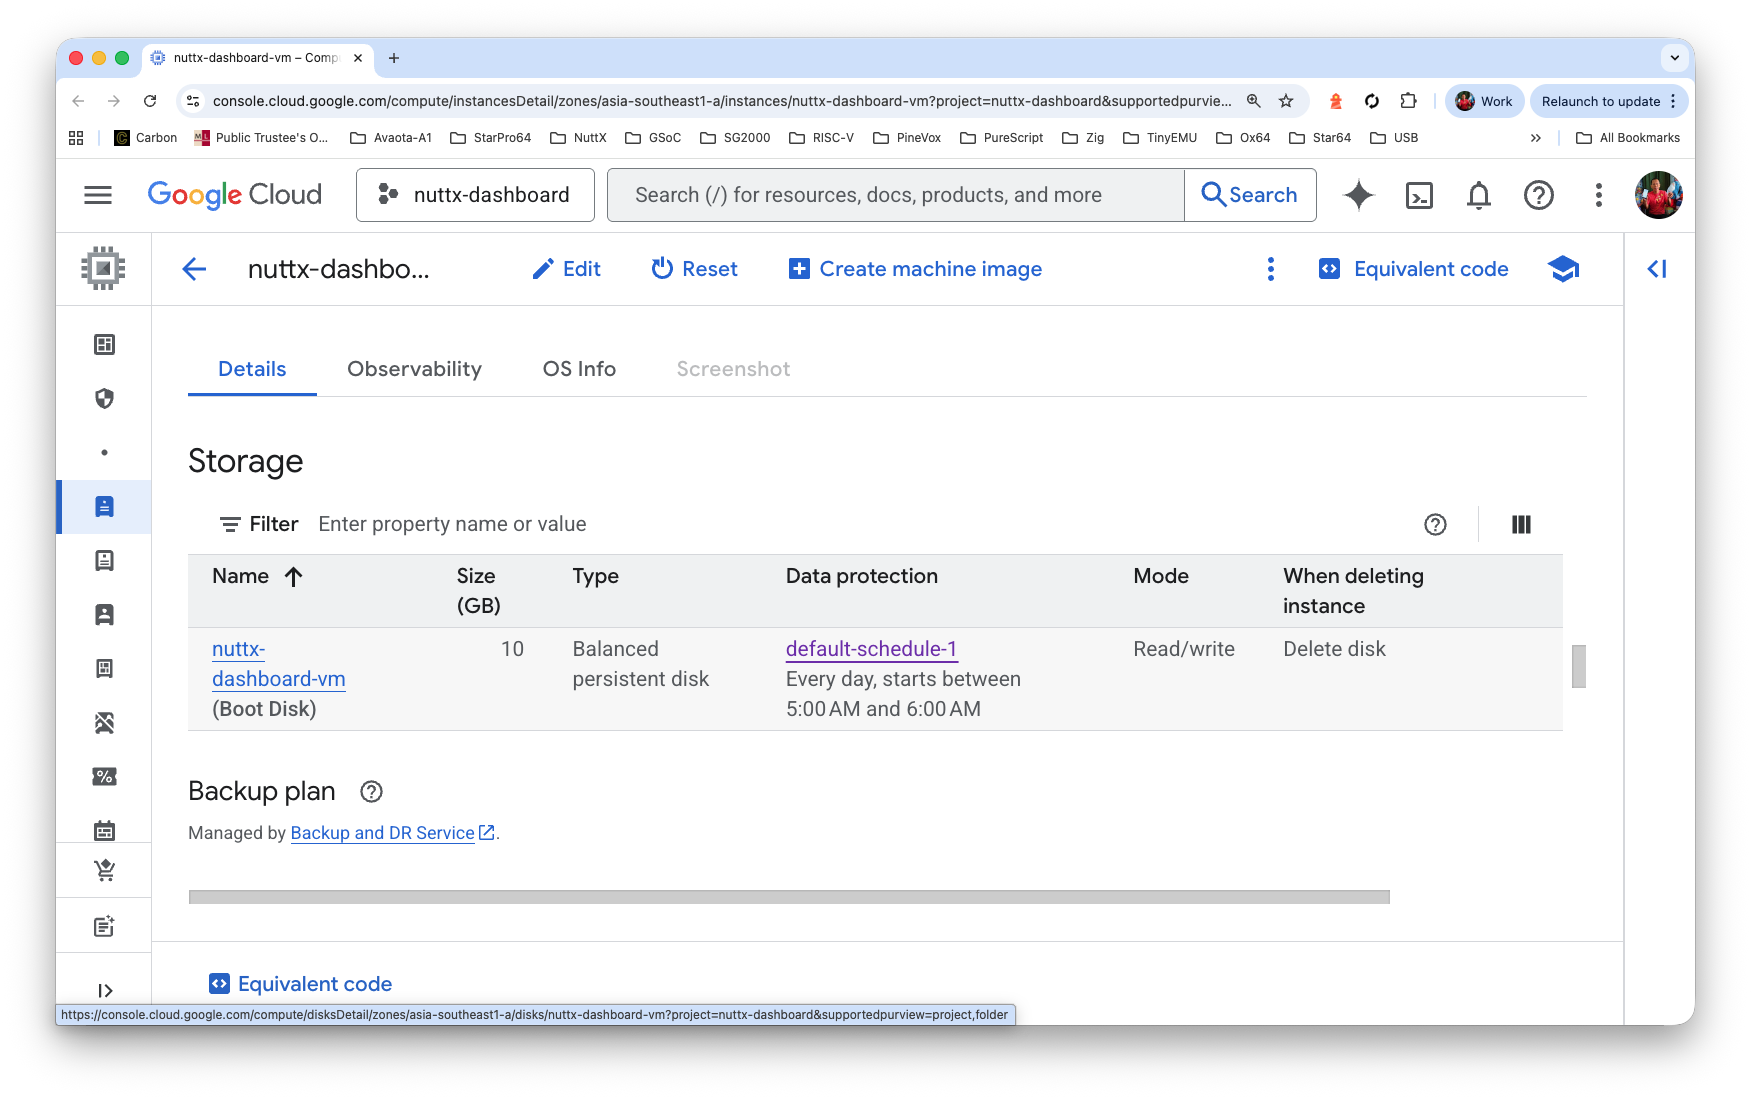
Click “Menu > Edit” (Top Right)
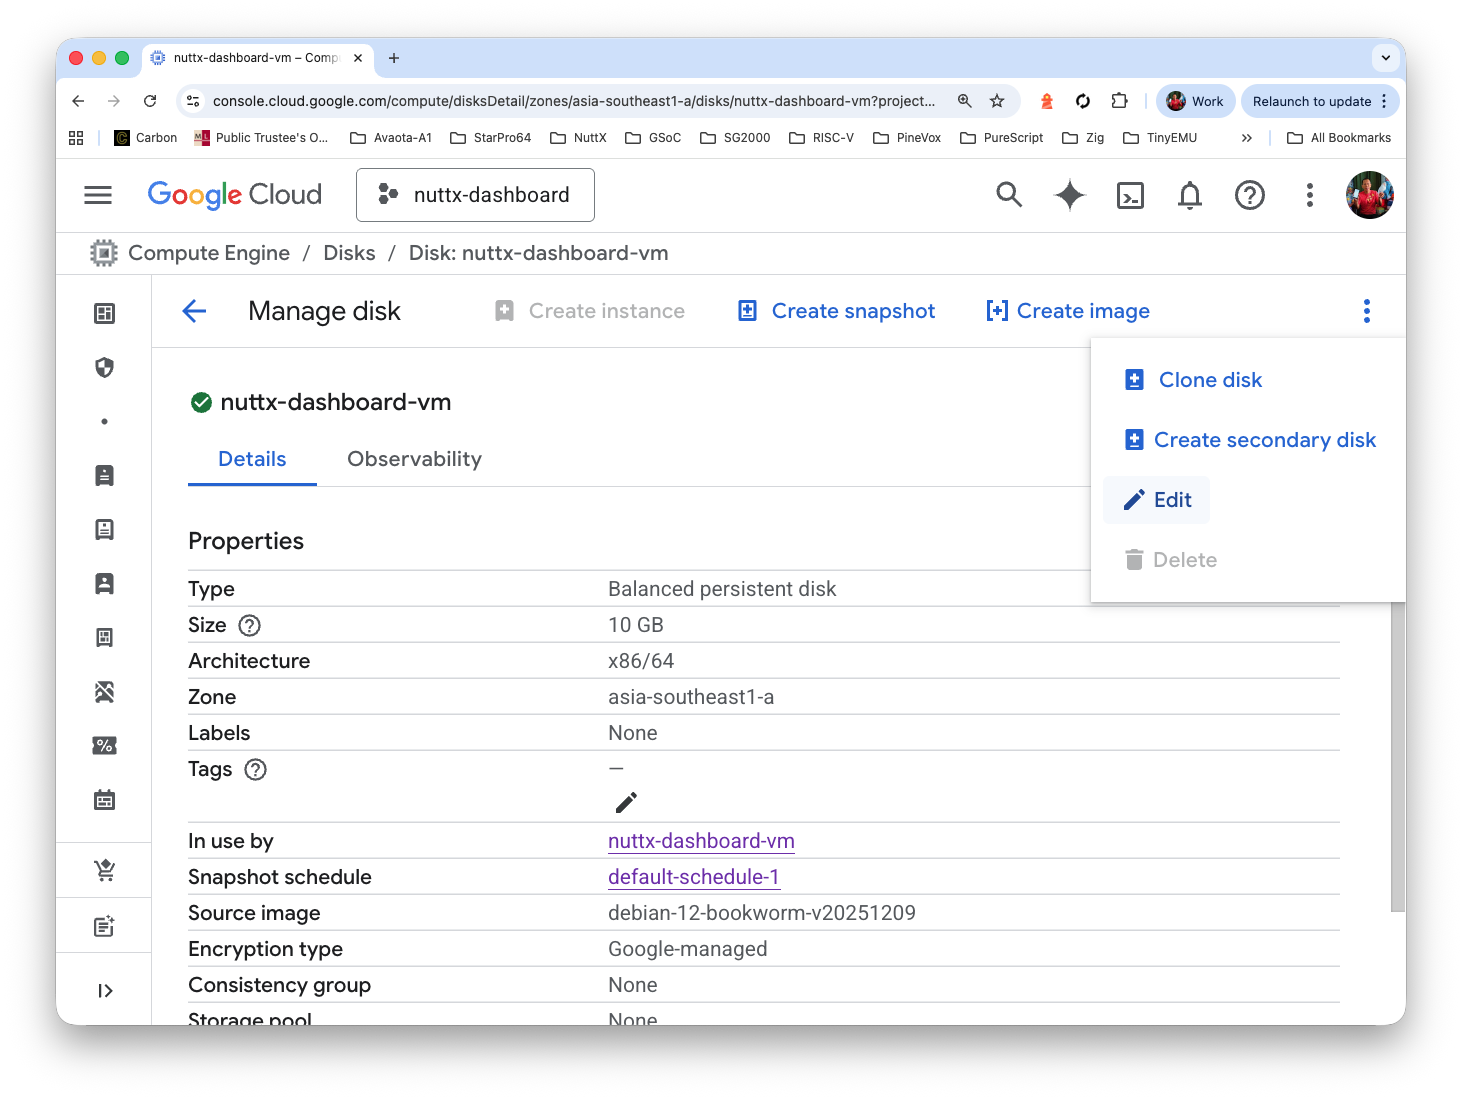
Increase the size from 10 GB to 80 GB. Click Save
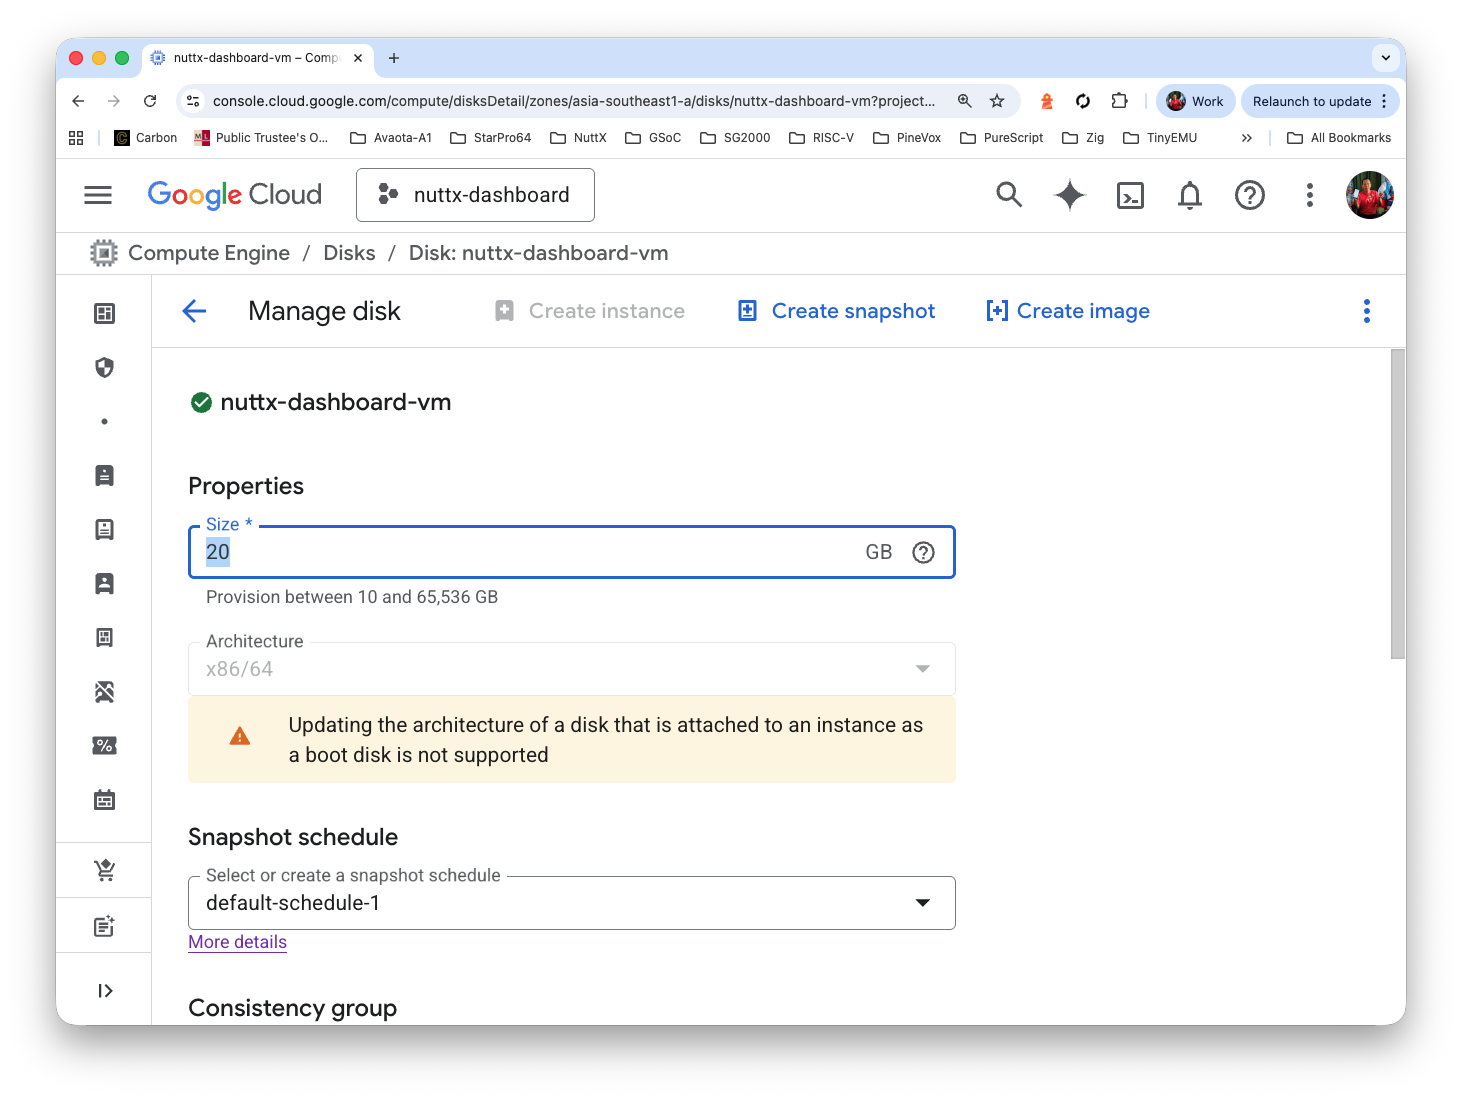
(Update: Pic should show 80 GB)
Inside our VM: Do this…
sudo apt install fdisk
sudo fdisk -l

## We should see
## Device      Start      End  Sectors  Size Type
## /dev/sda1  262144 20969471 20707328  9.9G Linux root (x86-64)
## /dev/sda14   2048     8191     6144    3M BIOS boot
## /dev/sda15   8192   262143   253952  124M EFI System

## Let's expand /dev/sda to 80 GB
sudo fdisk /dev/sda

## Ignore the warning
## Enter: w

## Resize partition 1 (/dev/sda1), which maps to /
sudo apt install cloud-guest-utils
sudo growpart /dev/sda 1

## We should see...
## CHANGED: partition=1 start=262144 old: size=20707328 end=20969471 new: size=167509983 end=167772126

## Resize the Filesystem
sudo resize2fs /dev/sda1

## We should see...
## Filesystem at /dev/sda1 is mounted on /; on-line resizing required
## old_desc_blocks = 2, new_desc_blocks = 10
## The filesystem on /dev/sda1 is now 20938747 (4k) blocks long.

## sda1 is bigger now
$ sudo fdisk -l
Device      Start       End   Sectors  Size Type
/dev/sda1  262144 167772126 167509983 79.9G Linux root (x86-64)
/dev/sda14   2048      8191      6144    3M BIOS boot
/dev/sda15   8192    262143    253952  124M EFI System

## More space in /tmp yay!
$ df -H
Filesystem      Size  Used Avail Use% Mounted on
udev            2.1G     0  2.1G   0% /dev
tmpfs           412M  603k  411M   1% /run
/dev/sda1        85G   40G   42G  49% /
tmpfs           2.1G     0  2.1G   0% /dev/shm
tmpfs           5.3M     0  5.3M   0% /run/lock
/dev/sda15      130M   13M  118M  10% /boot/efi
tmpfs 412M 0 412M 0% /run/user/1000Our VM is running. How do we actually publish it at a Web URL?
Here are two ways…
Option One: We publish it with a Cloudflare Tunnel
Option Two: We publish to Any CDN
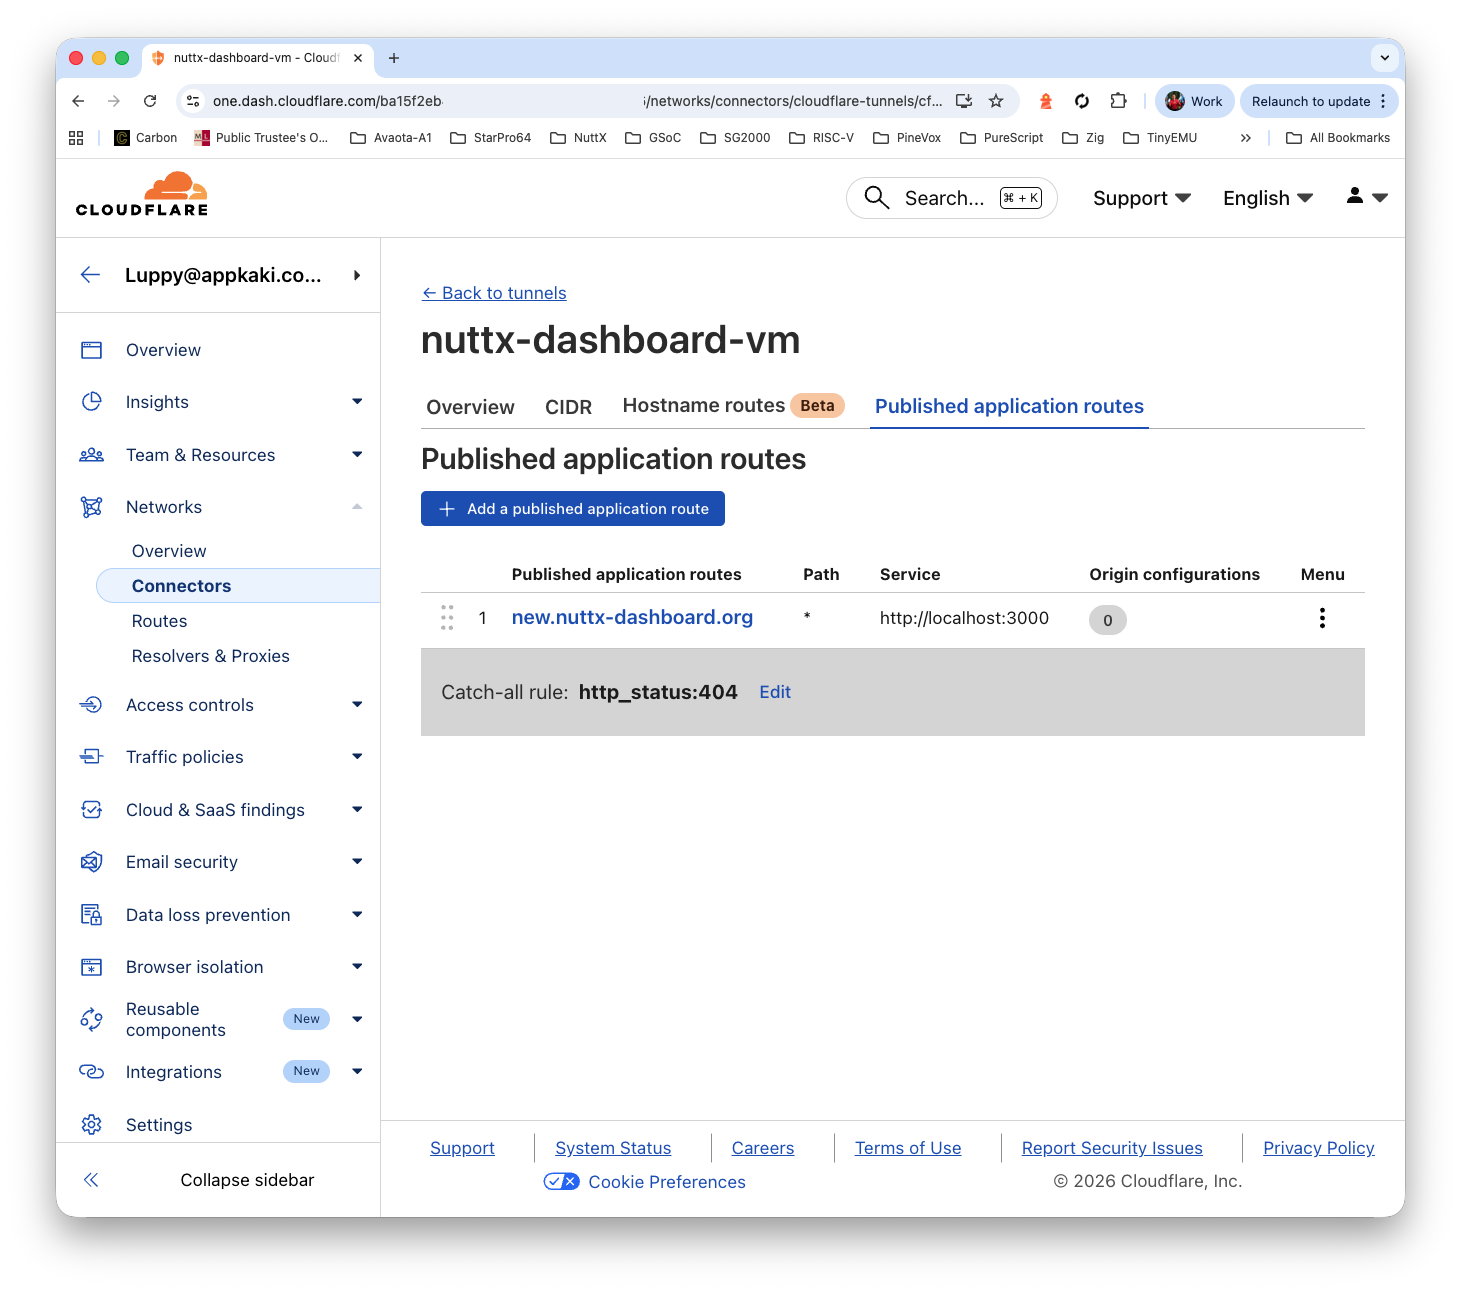
Option One: Cloudflare Tunnel
We create a Cloudflare Tunnel, pointing to…
http://localhost:3000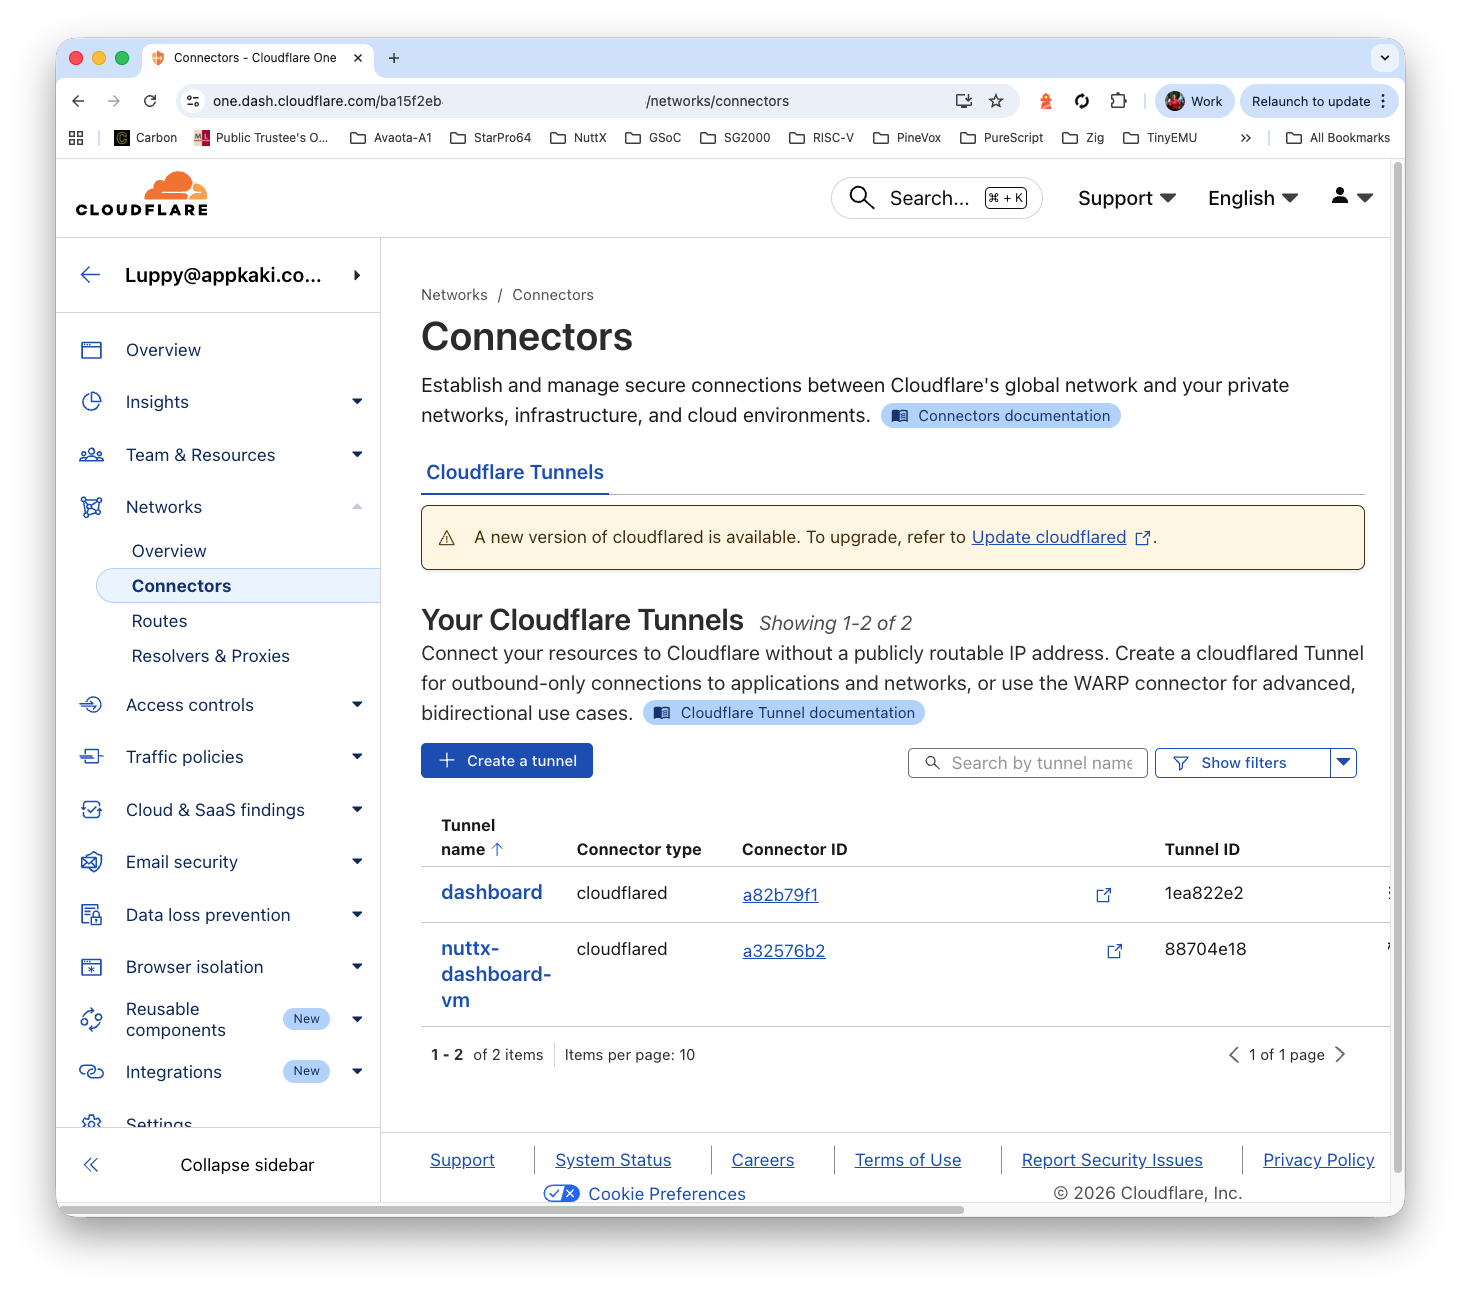
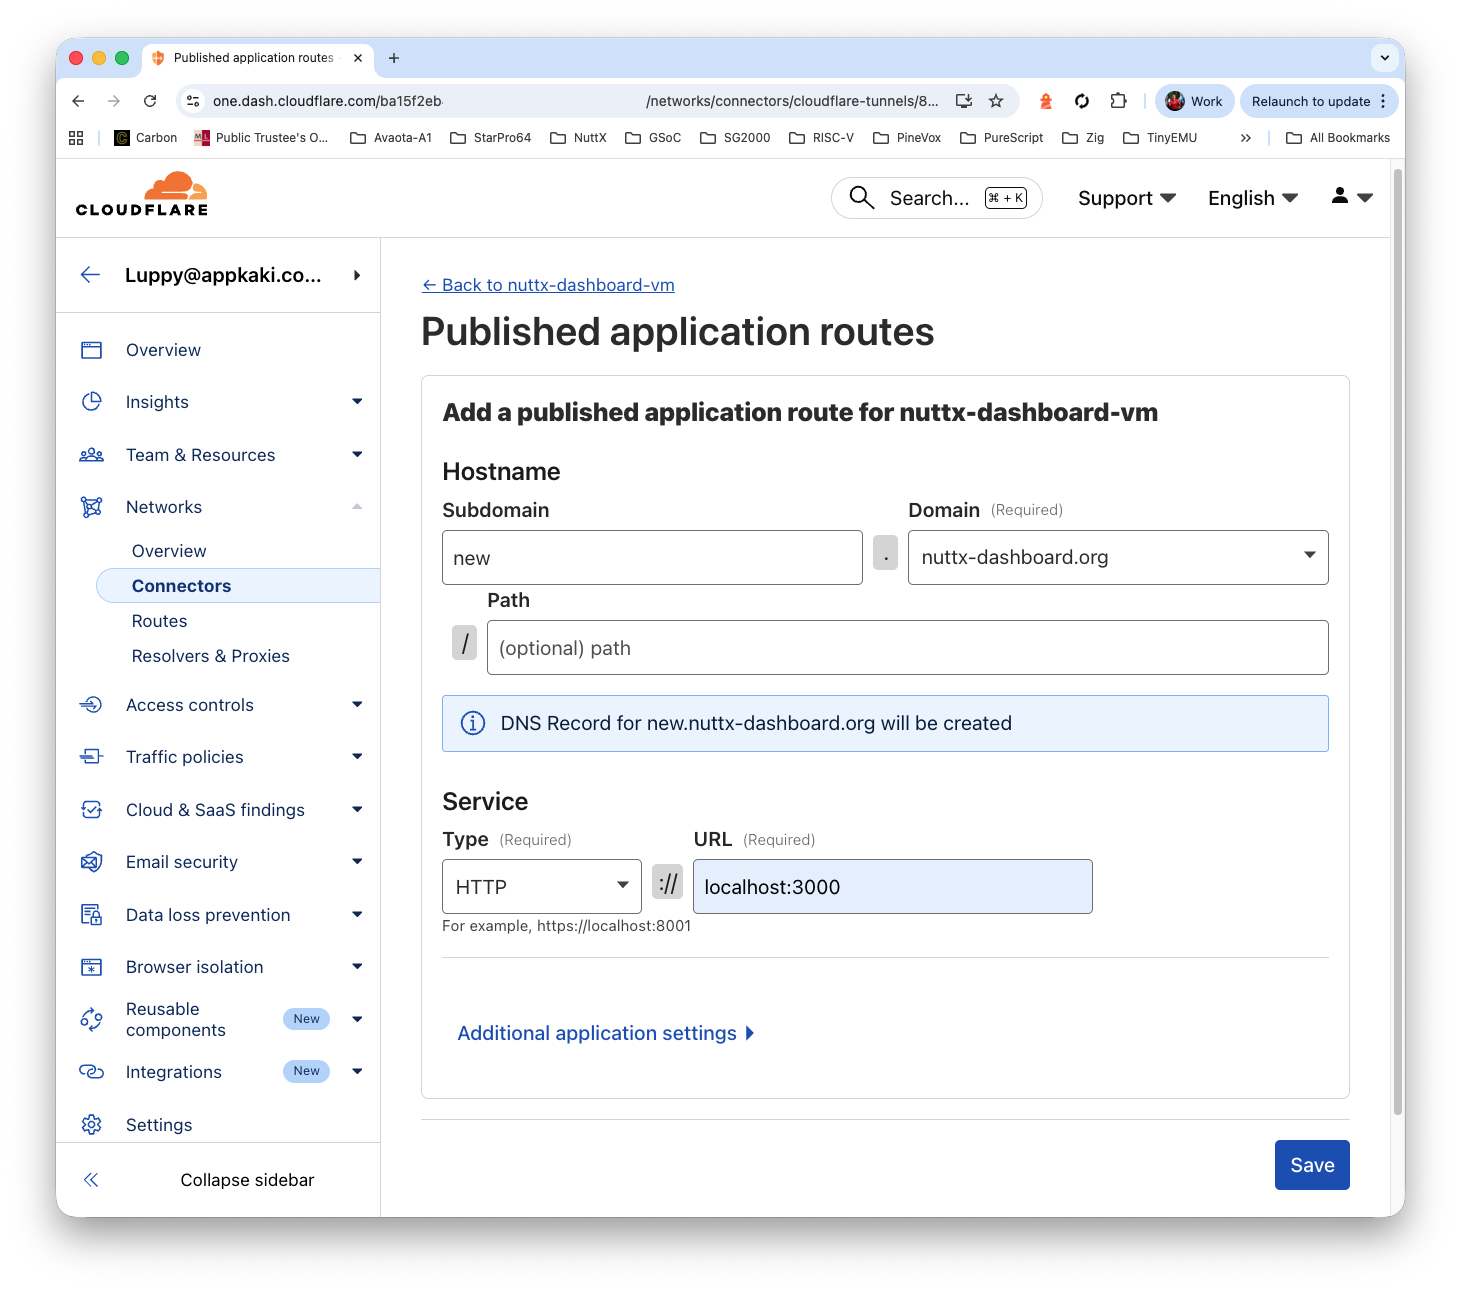
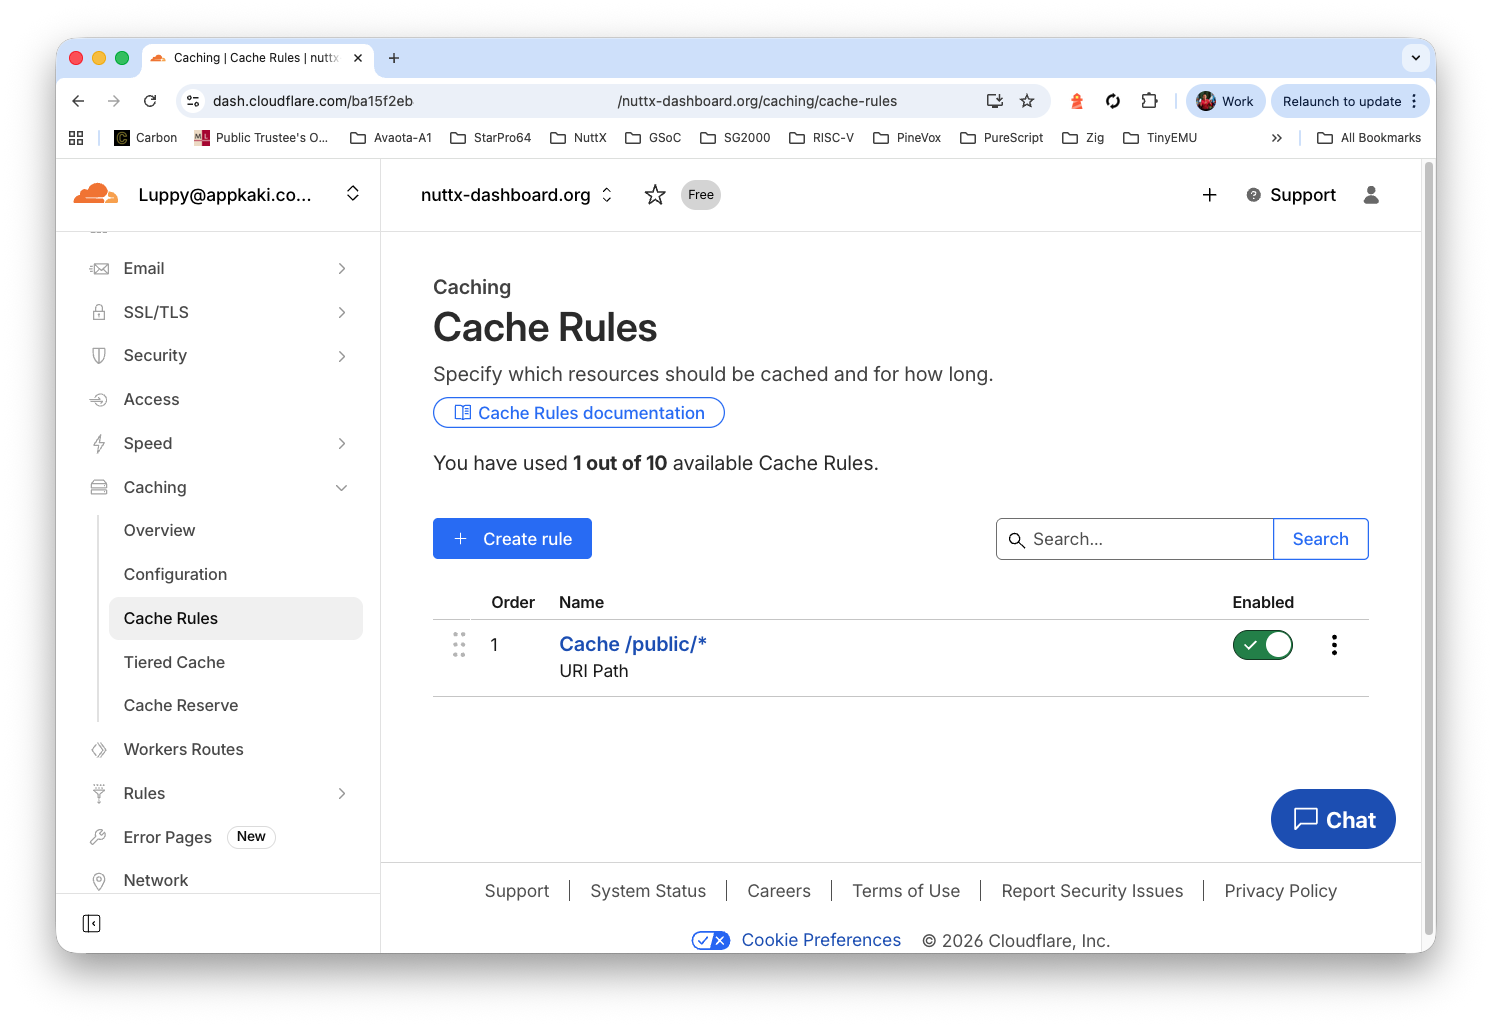
Remember to set the cache…
Set “Cache URI Path > Wildcard > Value” to…
/public/*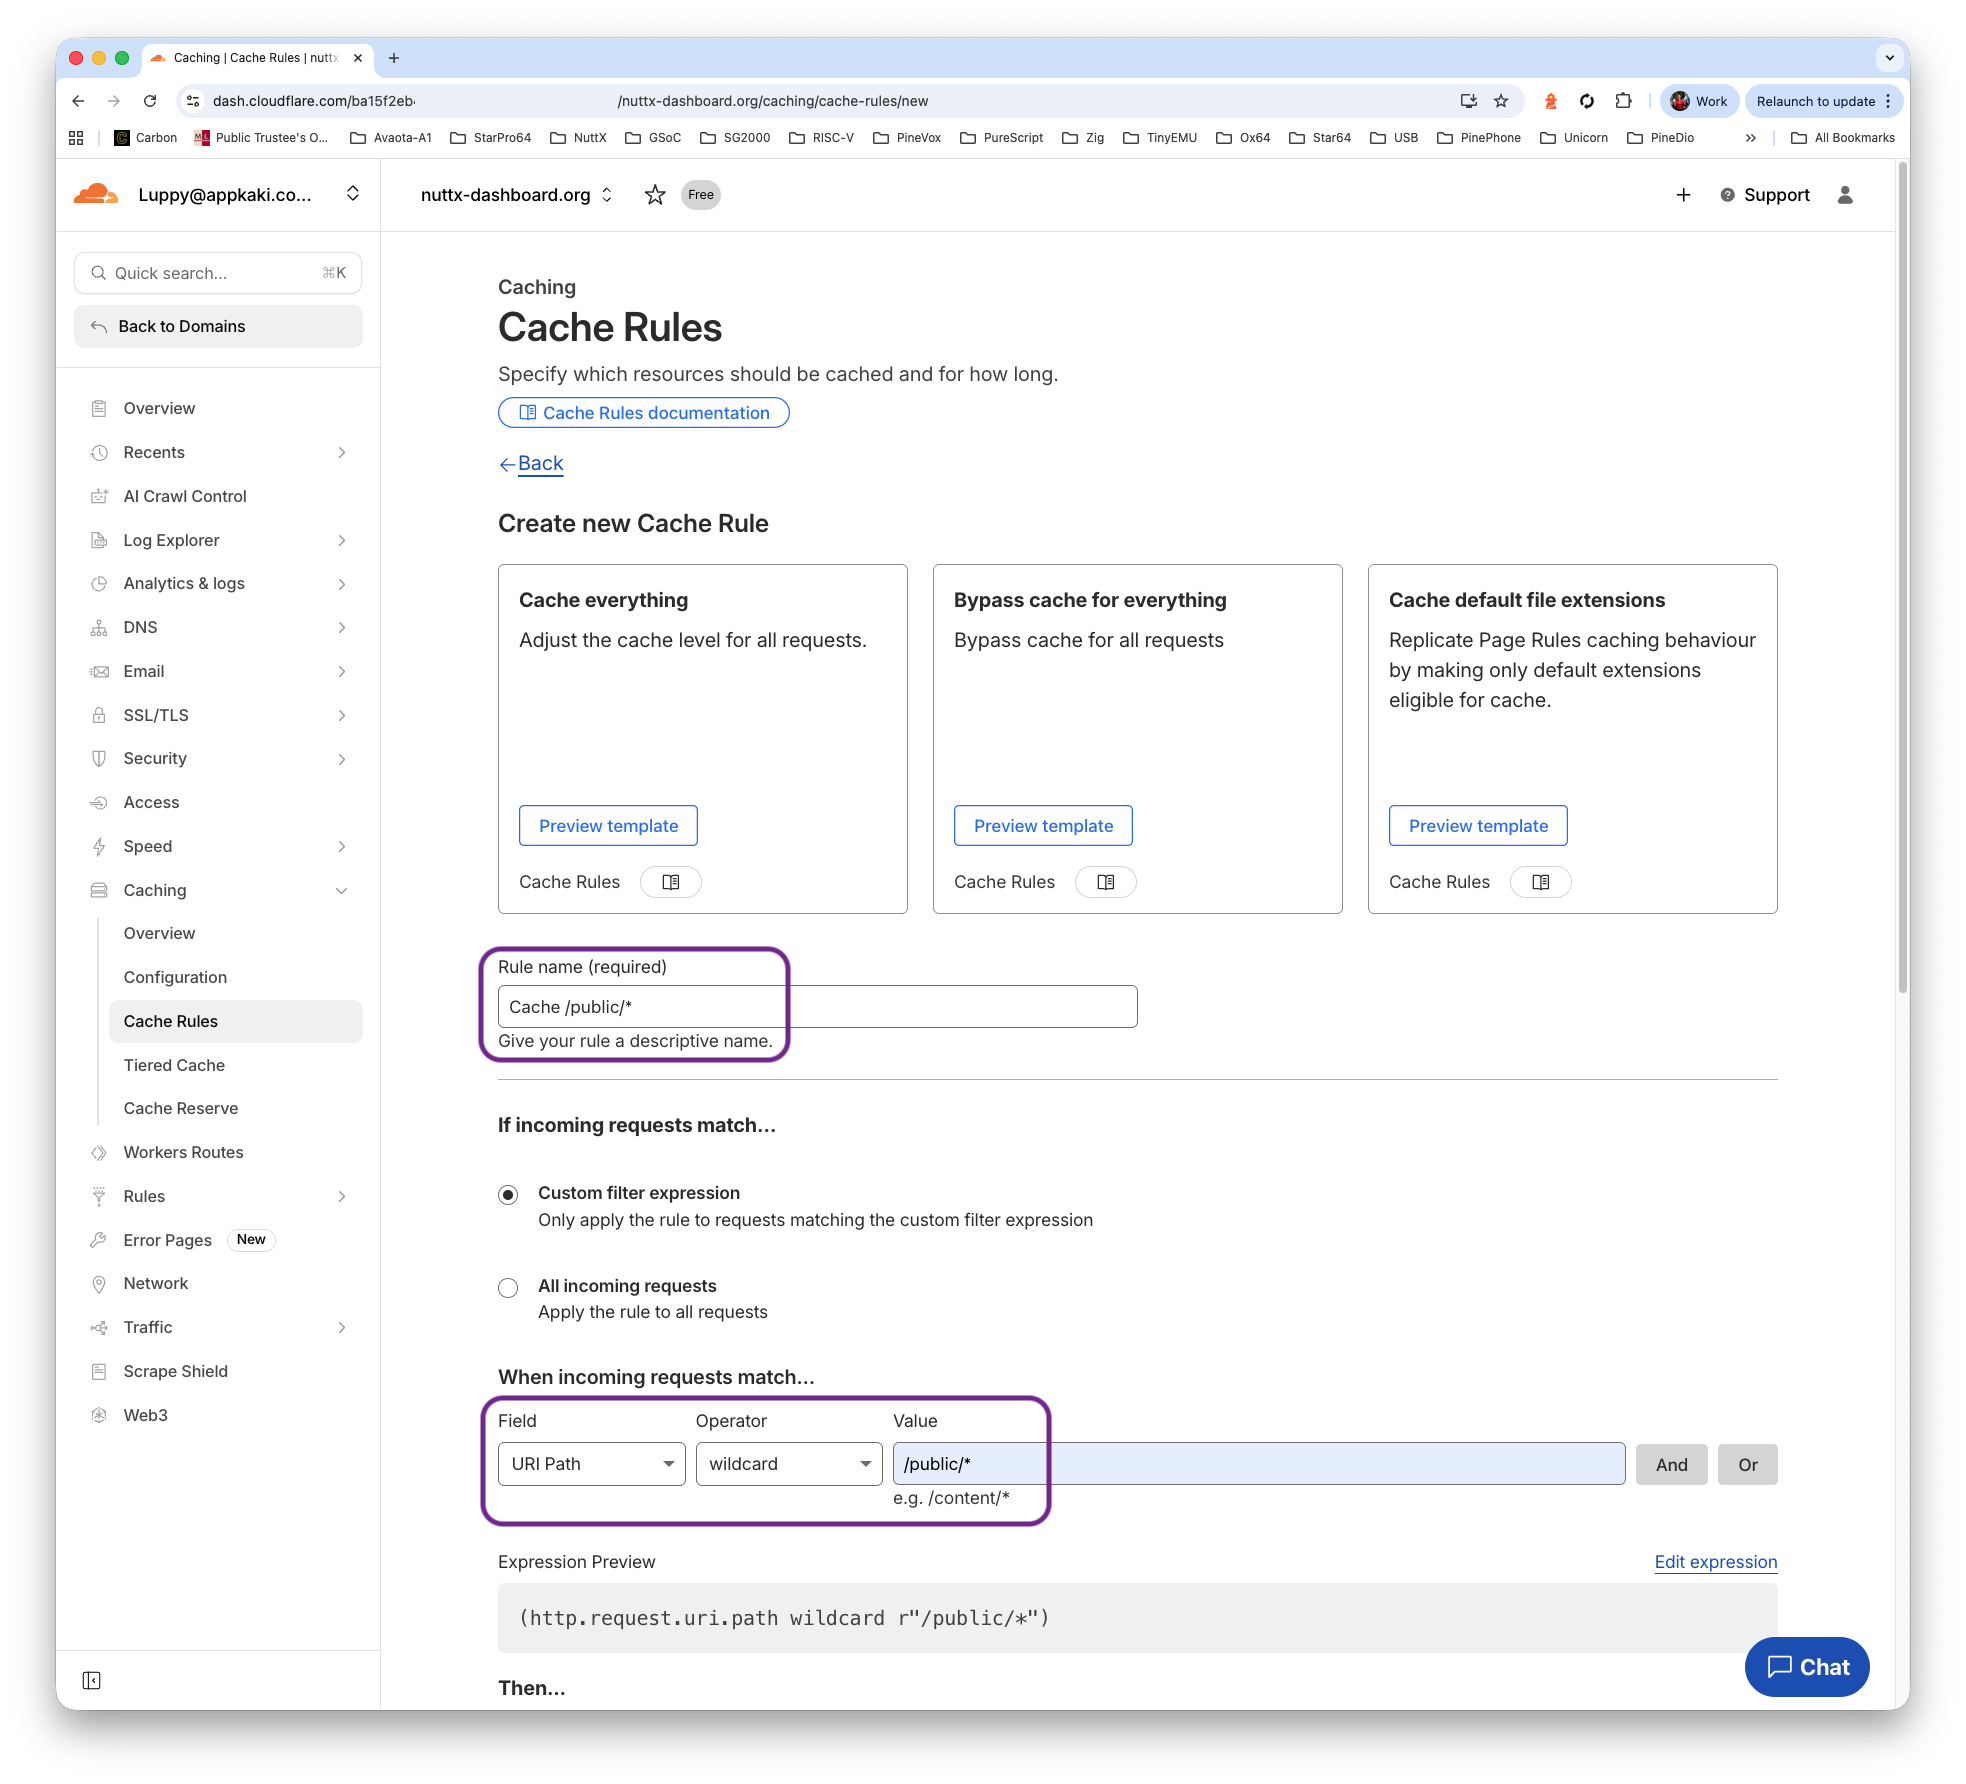
Option Two: Cloudflare CDN
Remember that Grafana listens at Port 3000? We configure iptables to route incoming packets from Port 80 to Port 3000…
## https://askubuntu.com/questions/444729/redirect-port-80-to-8080-and-make-it-work-on-local-machine

$ sudo iptables -t nat -A PREROUTING -p tcp --dport 80 -j REDIRECT --to-port 3000

$ sudo iptables -t nat -L -n -v

Chain PREROUTING (policy ACCEPT 0 packets, 0 bytes)
pkts bytes target     prot opt in     out     source               destination
    0     0 REDIRECT   6    --  *      *       0.0.0.0/0            0.0.0.0/0            tcp dpt:80 redir ports 3000

## To delete the rule:
## sudo iptables -t nat -D PREROUTING -p tcp --dport 80 -j REDIRECT --to-port 3000
Configure our VM Firewall to allow HTTP traffic…
Click “VM > Edit > Dynamic Network Interfaces > Allow HTTP traffic”
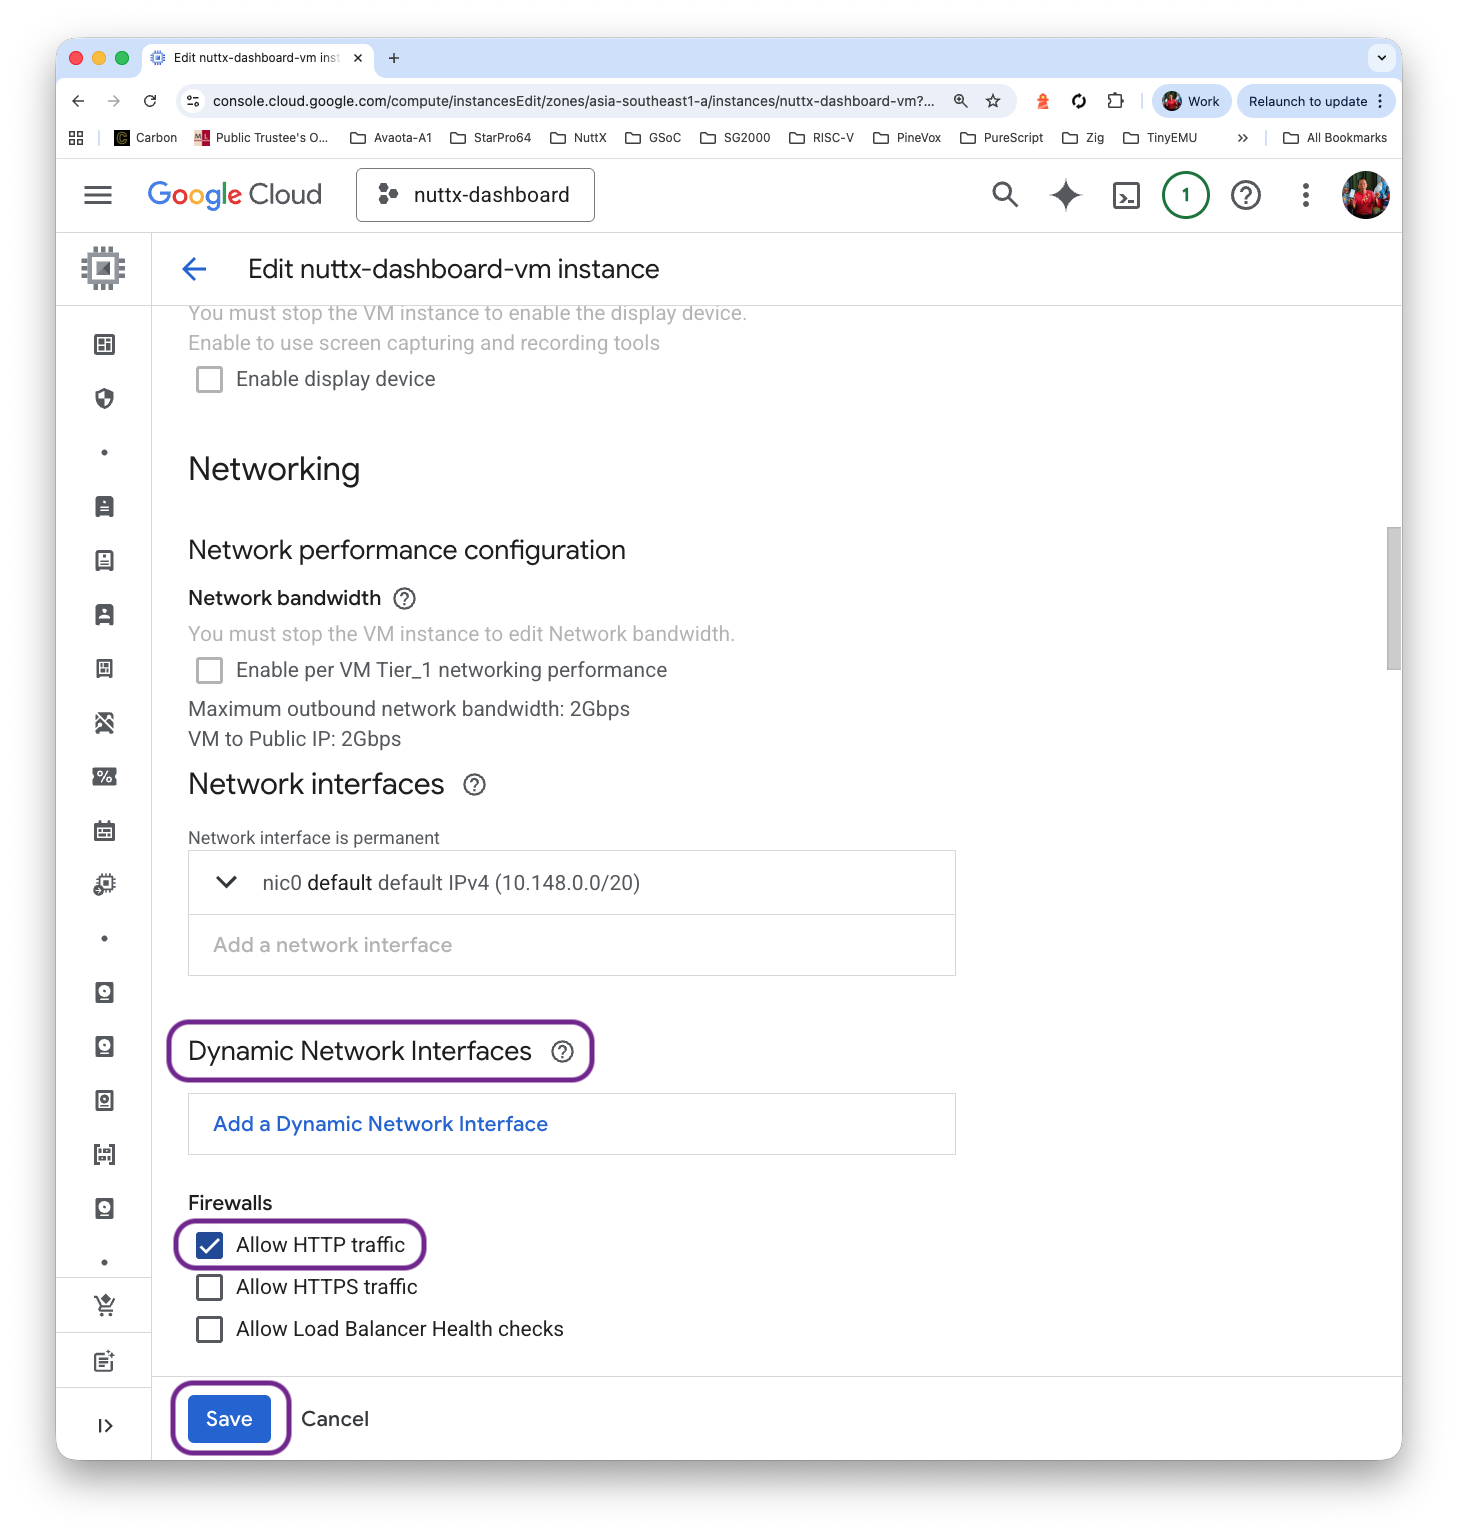
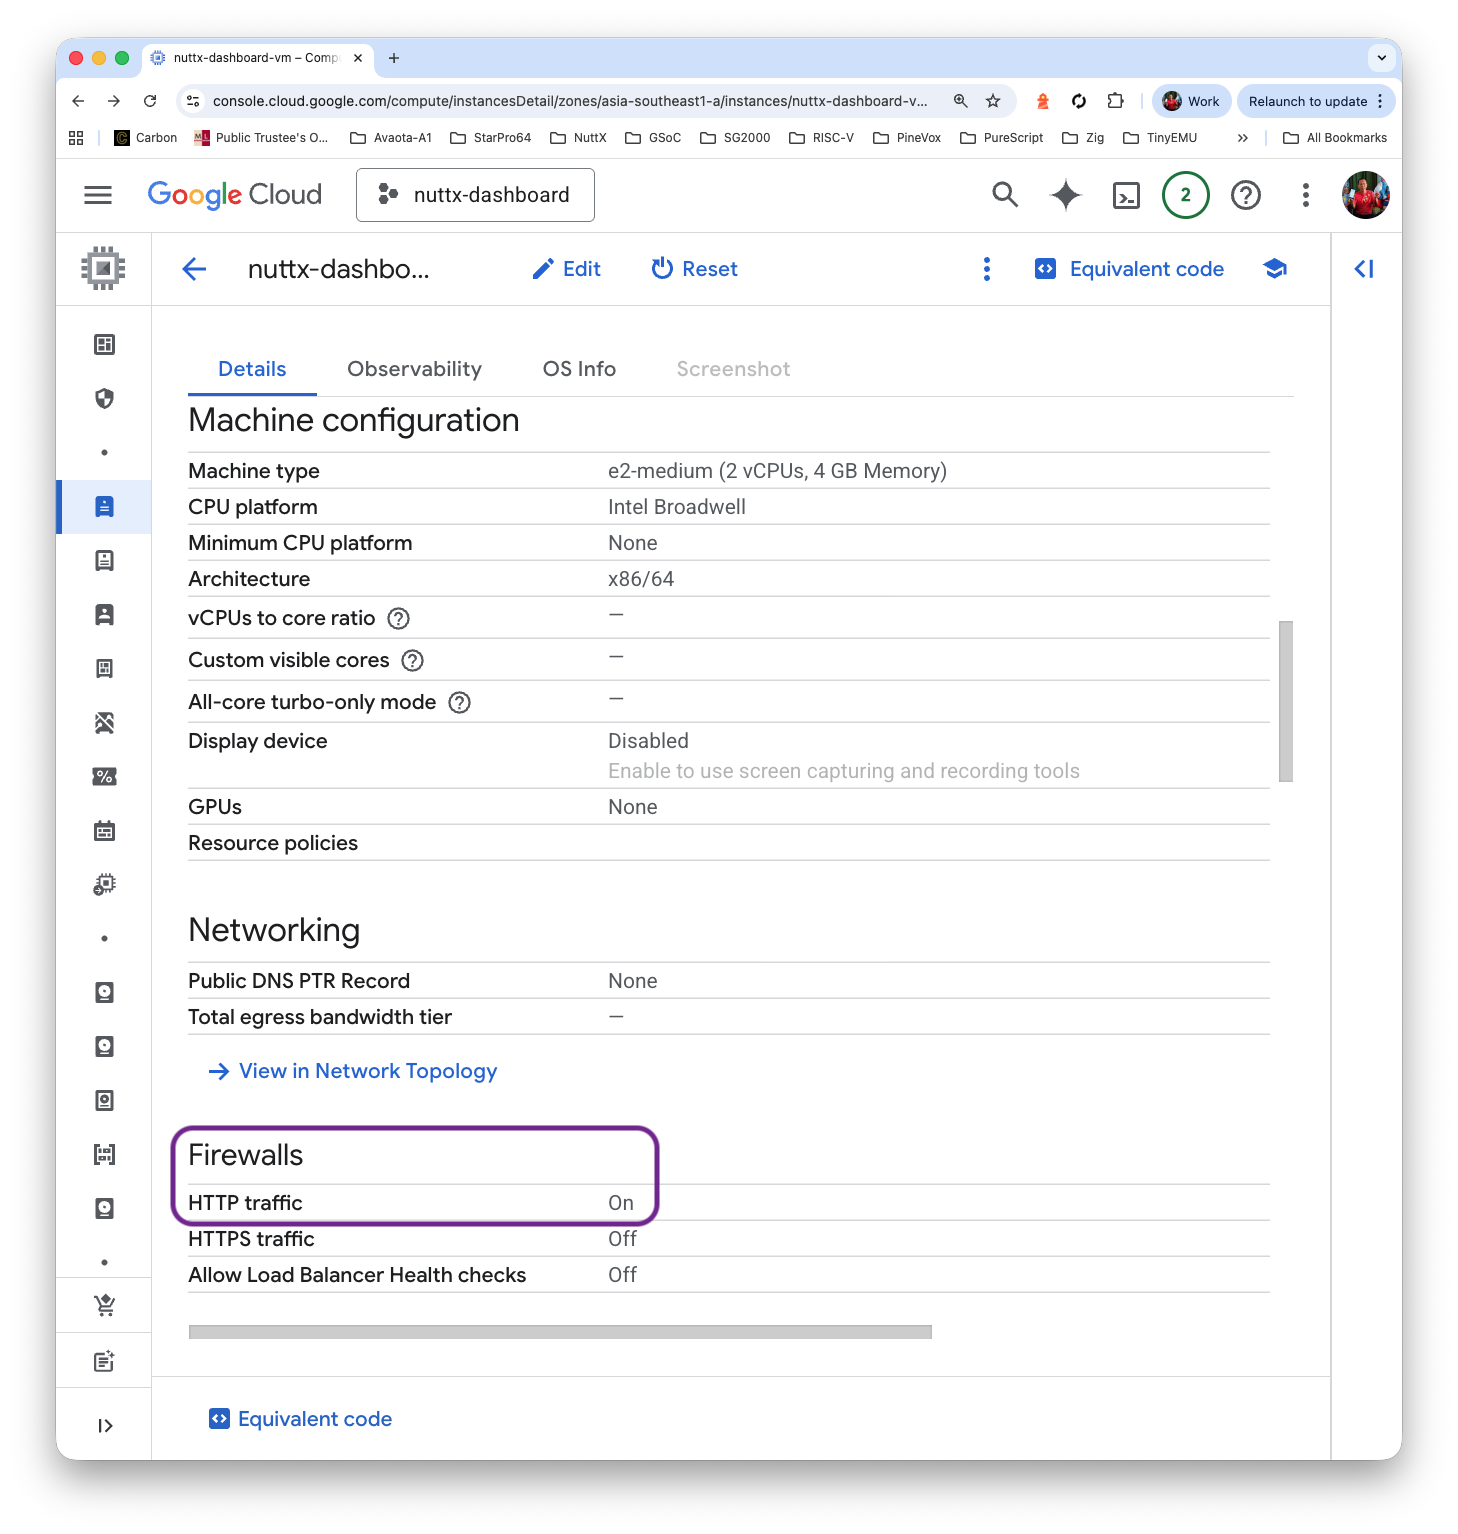
Why does this work? That’s because there’s a Default Firewall Rule “default-allow-http” that will allow incoming TCP Port 80, whenever the Target Tag matches “http-server”…
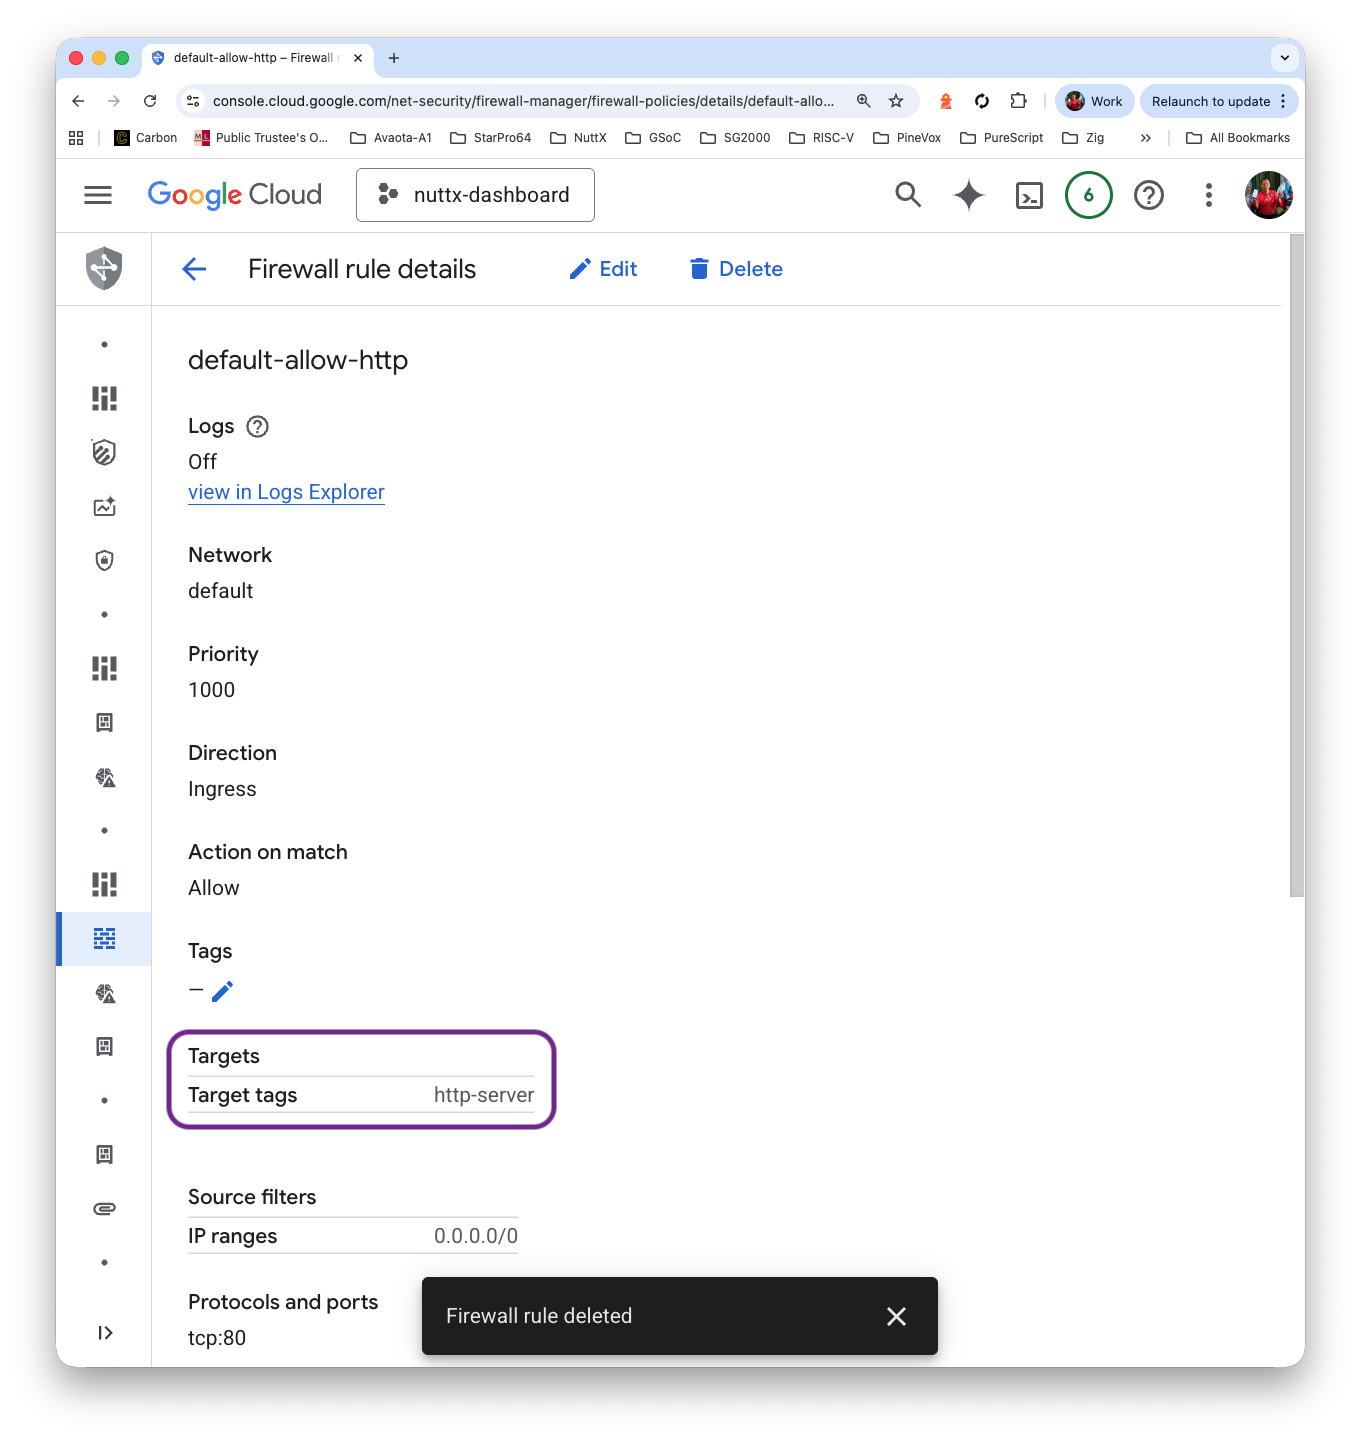
Check that our External IP Address is now accessible via HTTP Port 80…
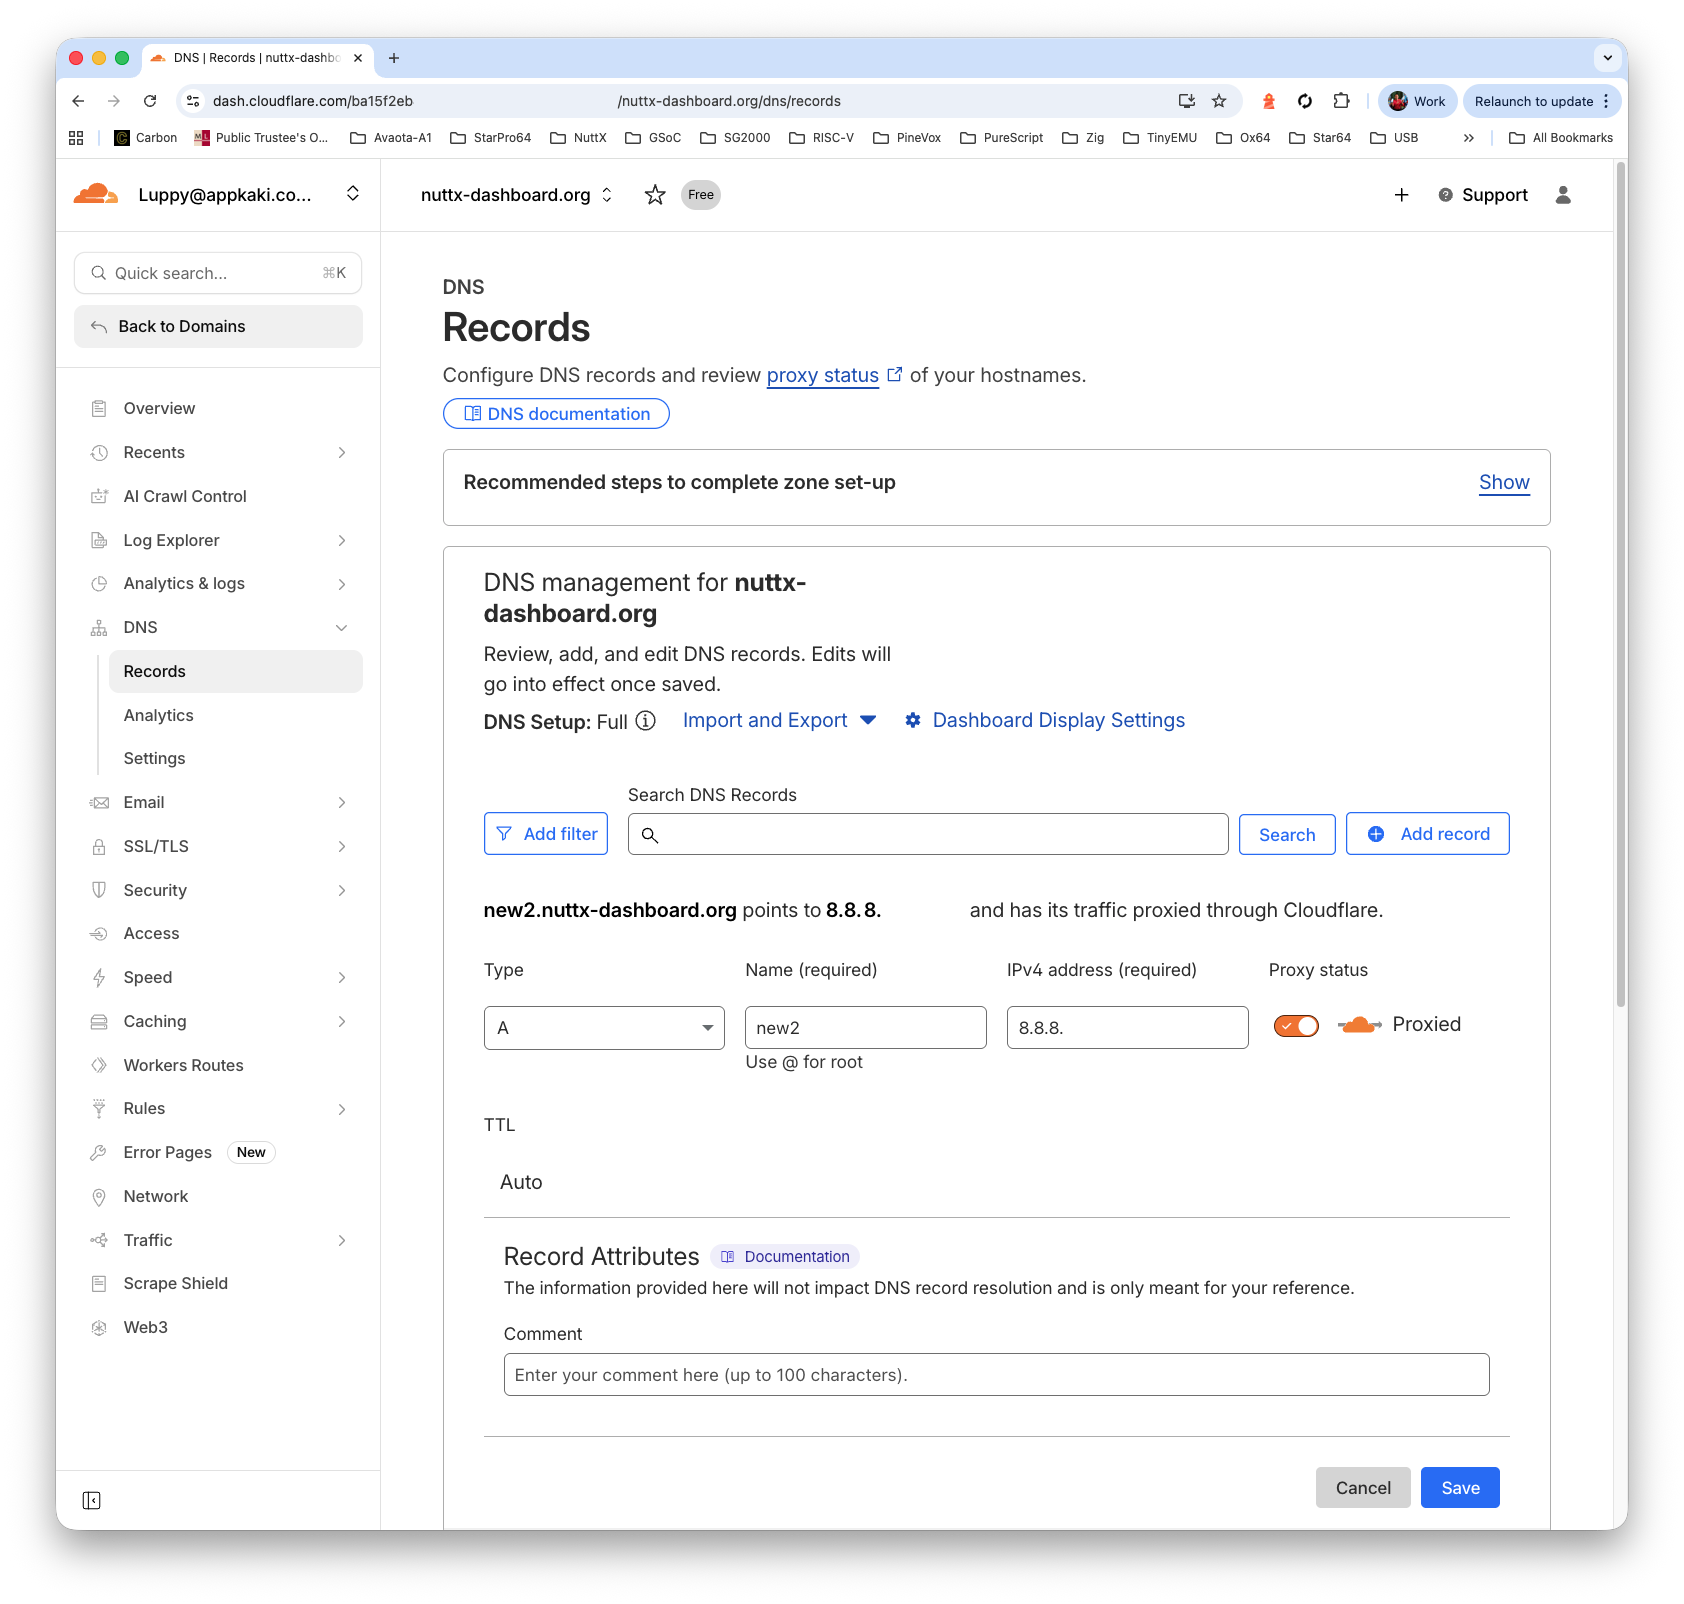
http://x.x.x.xUnder Cloudflare DNS: Create an “A Record” that points to our External IP Address.
Remember to Enable the HTTP Proxy.
(Actually we should get a Static IP Address for our VM)
And our NuttX Dashboard is live on the web!